Bank of America 2013 Annual Report Download - page 47
Download and view the complete annual report
Please find page 47 of the 2013 Bank of America annual report below. You can navigate through the pages in the report by either clicking on the pages listed below, or by using the keyword search tool below to find specific information within the annual report.-
 1
1 -
2
-
3
-
4
-
5
-
6
-
7
-
8
-
9
-
10
-
11
-
12
-
13
-
14
-
15
-
16
-
17
-
18
-
19
-
20
-
21
-
22
-
23
-
24
-
25
-
26
-
27
-
28
-
29
-
30
-
31
-
32
-
33
-
34
-
35
-
36
-
 37
37 -
 38
38 -
 39
39 -
 40
40 -
 41
41 -
 42
42 -
 43
43 -
 44
44 -
 45
45 -
 46
46 -
 47
47 -
 48
48 -
 49
49 -
 50
50 -
 51
51 -
 52
52 -
 53
53 -
 54
54 -
 55
55 -
 56
56 -
 57
57 -
58
-
59
-
60
-
61
-
62
-
63
-
64
-
65
-
66
-
67
-
68
-
69
-
70
-
71
-
72
-
73
-
74
-
75
-
76
-
77
-
78
-
79
-
80
-
81
-
82
-
83
-
84
-
85
-
86
-
87
-
88
-
89
-
90
-
91
-
92
-
93
-
94
-
95
-
96
-
97
-
98
-
99
-
100
-
101
-
102
-
103
-
104
-
105
-
106
-
107
-
108
-
109
-
110
-
111
-
112
-
113
-
114
-
115
-
116
-
117
-
118
-
119
-
120
-
121
-
122
-
123
-
124
-
125
-
126
-
127
-
128
-
129
-
130
-
131
-
132
-
133
-
134
-
135
-
136
-
137
-
138
-
139
-
140
-
141
-
142
-
143
-
144
-
145
-
146
-
147
-
148
-
149
-
150
-
151
-
152
-
153
-
154
-
155
-
156
-
157
-
158
-
159
-
160
-
161
-
162
-
163
-
164
-
165
-
166
-
167
-
168
-
169
-
170
-
171
-
172
-
173
-
174
-
175
-
176
-
177
-
178
-
179
-
180
-
181
-
182
-
183
-
184
-
185
-
186
-
187
-
188
-
189
-
190
-
191
-
192
-
193
-
194
-
195
-
196
-
197
-
198
-
199
-
200
-
201
-
202
-
203
-
204
-
205
-
206
-
207
-
208
-
209
-
210
-
211
-
212
-
213
-
214
-
215
-
216
-
217
-
218
-
219
-
220
-
221
-
222
-
223
-
224
-
225
-
226
-
227
-
228
-
229
-
230
-
231
-
232
-
233
-
234
-
235
-
236
-
237
-
238
-
239
-
240
-
241
-
242
-
243
-
244
-
245
-
246
-
247
-
248
-
249
-
250
-
251
-
252
-
253
-
254
-
255
-
256
-
257
-
258
-
259
-
260
-
261
-
262
-
263
-
264
-
265
-
266
-
267
-
268
-
269
-
270
-
271
-
272
-
273
-
274
-
275
-
276
-
277
-
278
-
279
-
280
-
281
-
282
-
283
-
284
 |
 |

Bank of America 2013 45
obligations, commercial mortgage-backed securities, RMBS,
collateralized debt obligations (CDOs), interest rate and credit
derivative contracts), currencies (interest rate and foreign
exchange contracts), commodities (primarily futures, forwards,
swaps and options) and equities (equity-linked derivatives and
cash equity activity). The table below and related discussion
present sales and trading revenue, substantially all of which is in
Global Markets, with the remainder in Global Banking. In addition,
the table below and related discussion present sales and trading
revenue excluding DVA, which is a non-GAAP financial measure.
We believe the use of this non-GAAP financial measure provides
clarity in assessing the underlying performance of these
businesses.
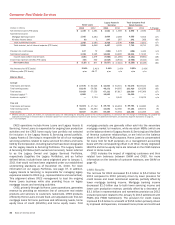
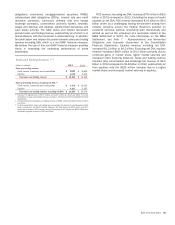
Sales and Trading Revenue (1, 2)
(Dollars in millions) 2013 2012
Sales and trading revenue
Fixed income, currencies and commodities $ 8,882 $ 8,812
Equities 4,200 3,014
Total sales and trading revenue $ 13,082 $ 11,826
Sales and trading revenue, excluding net DVA (3)
Fixed income, currencies and commodities $ 9,373 $ 11,007
Equities 4,217 3,267
Total sales and trading revenue, excluding net DVA $ 13,590 $ 14,274
(1) Includes FTE adjustments of $179 million and $220 million for 2013 and 2012. For more
information on sales and trading revenue, see Note 2 – Derivatives to the Consolidated Financial
Statements.
(2) Includes Global Banking sales and trading revenue of $385 million and $522 million for 2013
and 2012.
(3) For this presentation, sales and trading revenue excludes the impact of credit spreads on DVA,
which represents a non-GAAP financial measure. Net DVA losses of $491 million and $2.2
billion were included in FICC revenue, and net DVA losses of $17 million and $253 million were
included in equities revenue in 2013 and 2012.
FICC revenue, including net DVA, increased $70 million to $8.9
billion in 2013 compared to 2012. Excluding the impact of credit
spreads on net DVA, FICC revenue decreased $1.6 billion to $9.4
billion driven by a challenging trading environment arising from
investor concerns around the Federal Reserve’s position on
economic stimulus, political uncertainty both domestically and
abroad as well as the write-down of a receivable related to the
MBIA Settlement in 2013. For more information on the MBIA
Settlement, see Note 7 – Representations and Warranties
Obligations and Corporate Guarantees to the Consolidated
Financial Statements. Equities revenue, including net DVA,
increased $1.2 billion to $4.2 billion. Excluding net DVA, equities
revenue increased $950 million to $4.2 billion primarily due to
continued gains in market share, higher market volumes and
increased client financing balances. Sales and trading revenue
included total commissions and brokerage fee revenue of $2.0
billion in 2013 compared to $1.8 billion in 2012, substantially all
from equities, with the $226 million increase due to a higher
market share and increased market volumes in equities.