Bank of America 2013 Annual Report Download - page 36
Download and view the complete annual report
Please find page 36 of the 2013 Bank of America annual report below. You can navigate through the pages in the report by either clicking on the pages listed below, or by using the keyword search tool below to find specific information within the annual report.-
 1
1 -
2
-
3
-
4
-
5
-
6
-
7
-
8
-
9
-
10
-
11
-
12
-
13
-
14
-
15
-
16
-
17
-
18
-
19
-
20
-
21
-
22
-
23
-
24
-
25
-
 26
26 -
 27
27 -
 28
28 -
 29
29 -
 30
30 -
 31
31 -
 32
32 -
 33
33 -
 34
34 -
 35
35 -
 36
36 -
 37
37 -
 38
38 -
 39
39 -
 40
40 -
 41
41 -
 42
42 -
 43
43 -
 44
44 -
 45
45 -
 46
46 -
47
-
48
-
49
-
50
-
51
-
52
-
53
-
54
-
55
-
56
-
57
-
58
-
59
-
60
-
61
-
62
-
63
-
64
-
65
-
66
-
67
-
68
-
69
-
70
-
71
-
72
-
73
-
74
-
75
-
76
-
77
-
78
-
79
-
80
-
81
-
82
-
83
-
84
-
85
-
86
-
87
-
88
-
89
-
90
-
91
-
92
-
93
-
94
-
95
-
96
-
97
-
98
-
99
-
100
-
101
-
102
-
103
-
104
-
105
-
106
-
107
-
108
-
109
-
110
-
111
-
112
-
113
-
114
-
115
-
116
-
117
-
118
-
119
-
120
-
121
-
122
-
123
-
124
-
125
-
126
-
127
-
128
-
129
-
130
-
131
-
132
-
133
-
134
-
135
-
136
-
137
-
138
-
139
-
140
-
141
-
142
-
143
-
144
-
145
-
146
-
147
-
148
-
149
-
150
-
151
-
152
-
153
-
154
-
155
-
156
-
157
-
158
-
159
-
160
-
161
-
162
-
163
-
164
-
165
-
166
-
167
-
168
-
169
-
170
-
171
-
172
-
173
-
174
-
175
-
176
-
177
-
178
-
179
-
180
-
181
-
182
-
183
-
184
-
185
-
186
-
187
-
188
-
189
-
190
-
191
-
192
-
193
-
194
-
195
-
196
-
197
-
198
-
199
-
200
-
201
-
202
-
203
-
204
-
205
-
206
-
207
-
208
-
209
-
210
-
211
-
212
-
213
-
214
-
215
-
216
-
217
-
218
-
219
-
220
-
221
-
222
-
223
-
224
-
225
-
226
-
227
-
228
-
229
-
230
-
231
-
232
-
233
-
234
-
235
-
236
-
237
-
238
-
239
-
240
-
241
-
242
-
243
-
244
-
245
-
246
-
247
-
248
-
249
-
250
-
251
-
252
-
253
-
254
-
255
-
256
-
257
-
258
-
259
-
260
-
261
-
262
-
263
-
264
-
265
-
266
-
267
-
268
-
269
-
270
-
271
-
272
-
273
-
274
-
275
-
276
-
277
-
278
-
279
-
280
-
281
-
282
-
283
-
284
 |
 |

34 Bank of America 2013
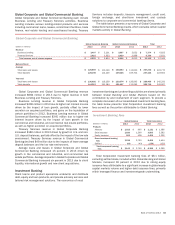
Deposits
Deposits includes the results of consumer deposit activities which
consist of a comprehensive range of products provided to
consumers and small businesses. Our deposit products include
traditional savings accounts, money market savings accounts, CDs
and IRAs, noninterest- and interest-bearing checking accounts, as
well as investment accounts and products. The revenue is
allocated to the deposit products using our funds transfer pricing
process that matches assets and liabilities with similar interest
rate sensitivity and maturity characteristics. Deposits generates
fees such as account service fees, non-sufficient funds fees,
overdraft charges and ATM fees, as well as investment and
brokerage fees from Merrill Edge accounts. Merrill Edge is an
integrated investing and banking service targeted at customers
with less than $250,000 in investable assets. Merrill Edge
provides investment advice and guidance, client brokerage asset
services, a self-directed online investing platform and key banking
capabilities including access to the Corporation’s network of
banking centers and ATMs.
Business Banking within Deposits provides a wide range of
lending-related products and services, integrated working capital
management and treasury solutions to clients through our network
of offices and client relationship teams along with various product
partners. Our clients include U.S.-based companies generally with
annual sales of $1 million to $50 million. Our lending products
and services include commercial loans, lines of credit and real
estate lending. Our capital management and treasury solutions
include treasury management, foreign exchange and short-term
investing options. Deposits also includes the results of our
merchant services joint venture.
Deposits includes the net impact of migrating customers and
their related deposit balances between Deposits and GWIM as
well as other client-managed businesses. For more information on
the migration of customer balances to or from GWIM, see GWIM
on page 40.
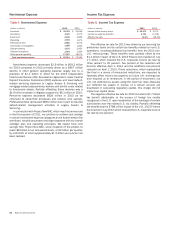
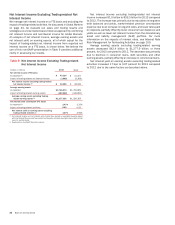
Net income for Deposits increased $866 million to $2.1 billion
in 2013 driven by higher revenue, a decrease in noninterest
expense and lower provision for credit losses. Net interest income
increased $762 million to $9.8 billion driven by the impact of
higher deposit balances, a customer shift to higher spread liquid
products and continued pricing discipline, partially offset by
compressed deposit spreads due to the continued low rate
environment. Noninterest income of $4.8 billion remained
relatively unchanged.
The provision for credit losses decreased $189 million to $299
million in 2013 due to improvements in credit quality in Business
Banking. Noninterest expense decreased $383 million to $10.9
billion due to lower operating, personnel and FDIC expenses.
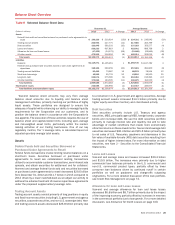
Average loans decreased $932 million to $22.4 billion in 2013
primarily driven by continued run-off of non-core portfolios. Average
deposits increased $43.6 billion to $518.5 billion in 2013 driven
by a customer shift to more liquid products in the low rate
environment. Additionally, $15.5 billion of the increase in average
deposits was due to net transfers from other businesses, largely
GWIM. Growth in checking, traditional savings and money market
savings of $49.5 billion was partially offset by a decline in time
deposits of $5.9 billion. As a result of our continued pricing
discipline and the shift in the mix of deposits, the rate paid on
average deposits declined by seven bps to 11 bps.
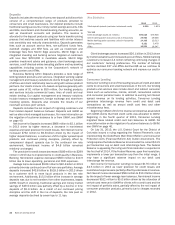
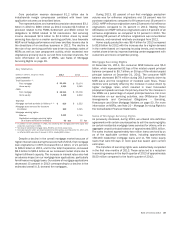
Key Statistics
2013 2012
Total deposit spreads (excludes noninterest costs) 1.52% 1.81%
Year end
Client brokerage assets (in millions) $96,048 $75,946
Online banking active accounts (units in thousands) 29,950 29,638
Mobile banking active accounts (units in thousands) 14,395 12,013
Banking centers 5,151 5,478
ATMs 16,259 16,347
Client brokerage assets increased $20.1 billion in 2013 driven
by market valuations and increased account flows. Mobile banking
customers increased 2.4 million reflecting continuing changes in
our customers’ banking preferences. The number of banking
centers declined 327 and ATMs declined 88 as we continue to
optimize our consumer banking network and improve our cost-to-
serve.
Consumer Lending
Consumer Lending is one of the leading issuers of credit and debit
cards to consumers and small businesses in the U.S. Our lending
products and services also include direct and indirect consumer
loans such as automotive, marine, aircraft, recreational vehicle
and consumer personal loans. In addition to earning net interest
spread revenue on its lending activities, Consumer Lending
generates interchange revenue from credit and debit card
transactions as well as annual credit card fees and other
miscellaneous fees.
Beginning in March 2013, the revenue and expense associated
with GWIM clients that hold credit cards was allocated to GWIM.
Beginning in the fourth quarter of 2013, Consumer Lending
migrated these related credit card loan balances to GWIM. For
more information on the migration of customer balances to GWIM,
see GWIM on page 40.
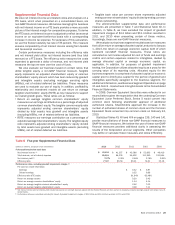
On July 31, 2013, the U.S. District Court for the District of
Columbia issued a ruling regarding the Federal Reserve’s rules
implementing the Dodd-Frank Wall Street Reform and Consumer
Protection Act’s (Financial Reform Act) Durbin Amendment. The
ruling requires the Federal Reserve to reconsider the current $0.21
per transaction cap on debit card interchange fees. The Federal
Reserve is appealing the ruling and final resolution is expected in
the first half of 2014. If the Federal Reserve, upon final resolution,
implements a lower per transaction cap than the initial range, it
may have a significant adverse impact on our debit card
interchange fee revenue.
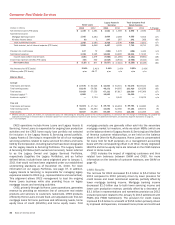
Net income for Consumer Lending increased $176 million to
$4.5 billion in 2013 as lower provision for credit losses and
noninterest expense were partially offset by a decrease in revenue.
Net interest income decreased $564 million to $10.2 billion driven
by the impact of lower average loan balances. Noninterest income
decreased $162 million to $5.0 billion driven by the allocation of
certain card revenue to GWIM for clients with a credit card and the
net impact of portfolio sales, partially offset by the net impact of
consumer protection products, primarily due to charges recorded
in 2012.