Bank of America 2013 Annual Report Download - page 274
Download and view the complete annual report
Please find page 274 of the 2013 Bank of America annual report below. You can navigate through the pages in the report by either clicking on the pages listed below, or by using the keyword search tool below to find specific information within the annual report.-
 1
1 -
2
-
3
-
4
-
5
-
6
-
7
-
8
-
9
-
10
-
11
-
12
-
13
-
14
-
15
-
16
-
17
-
18
-
19
-
20
-
21
-
22
-
23
-
24
-
25
-
26
-
27
-
28
-
29
-
30
-
31
-
32
-
33
-
34
-
35
-
36
-
37
-
38
-
39
-
40
-
41
-
42
-
43
-
44
-
45
-
46
-
47
-
48
-
49
-
50
-
51
-
52
-
53
-
54
-
55
-
56
-
57
-
58
-
59
-
60
-
61
-
62
-
63
-
64
-
65
-
66
-
67
-
68
-
69
-
70
-
71
-
72
-
73
-
74
-
75
-
76
-
77
-
78
-
79
-
80
-
81
-
82
-
83
-
84
-
85
-
86
-
87
-
88
-
89
-
90
-
91
-
92
-
93
-
94
-
95
-
96
-
97
-
98
-
99
-
100
-
101
-
102
-
103
-
104
-
105
-
106
-
107
-
108
-
109
-
110
-
111
-
112
-
113
-
114
-
115
-
116
-
117
-
118
-
119
-
120
-
121
-
122
-
123
-
124
-
125
-
126
-
127
-
128
-
129
-
130
-
131
-
132
-
133
-
134
-
135
-
136
-
137
-
138
-
139
-
140
-
141
-
142
-
143
-
144
-
145
-
146
-
147
-
148
-
149
-
150
-
151
-
152
-
153
-
154
-
155
-
156
-
157
-
158
-
159
-
160
-
161
-
162
-
163
-
164
-
165
-
166
-
167
-
168
-
169
-
170
-
171
-
172
-
173
-
174
-
175
-
176
-
177
-
178
-
179
-
180
-
181
-
182
-
183
-
184
-
185
-
186
-
187
-
188
-
189
-
190
-
191
-
192
-
193
-
194
-
195
-
196
-
197
-
198
-
199
-
200
-
201
-
202
-
203
-
204
-
205
-
206
-
207
-
208
-
209
-
210
-
211
-
212
-
213
-
214
-
215
-
216
-
217
-
218
-
219
-
220
-
221
-
222
-
223
-
224
-
225
-
226
-
227
-
228
-
229
-
230
-
231
-
232
-
233
-
234
-
235
-
236
-
237
-
238
-
239
-
240
-
241
-
242
-
243
-
244
-
245
-
246
-
247
-
248
-
249
-
250
-
251
-
252
-
253
-
254
-
255
-
256
-
257
-
258
-
259
-
260
-
261
-
262
-
263
-
 264
264 -
 265
265 -
 266
266 -
 267
267 -
 268
268 -
 269
269 -
 270
270 -
 271
271 -
 272
272 -
 273
273 -
 274
274 -
 275
275 -
 276
276 -
 277
277 -
 278
278 -
 279
279 -
 280
280 -
 281
281 -
 282
282 -
 283
283 -
 284
284
 |
 |
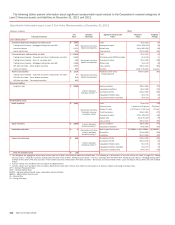
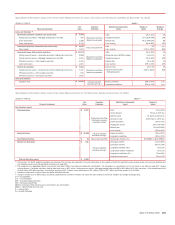
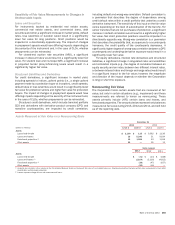
272 Bank of America 2013
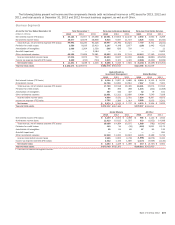
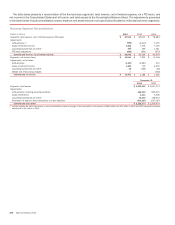
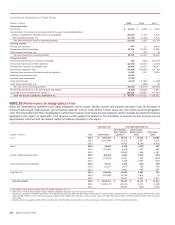
Basis of Presentation
The management accounting and reporting process derives
segment and business results by utilizing allocation
methodologies for revenue and expense. The net income derived
for the businesses is dependent upon revenue and cost allocations
using an activity-based costing model, funds transfer pricing, and
other methodologies and assumptions management believes are
appropriate to reflect the results of the business.
Total revenue, net of interest expense, includes net interest
income on a FTE basis and noninterest income. The adjustment
of net interest income to a FTE basis results in a corresponding
increase in income tax expense. The segment results also reflect
certain revenue and expense methodologies that are utilized to
determine net income. The net interest income of the businesses
includes the results of a funds transfer pricing process that
matches assets and liabilities with similar interest rate sensitivity
and maturity characteristics. For presentation purposes, in
segments where the total of liabilities and equity exceeds assets,
which are generally deposit-taking segments, the Corporation
allocates assets to match liabilities. Net interest income of the
business segments also includes an allocation of net interest
income generated by certain of the Corporation’s ALM activities.
In addition, the business segments are impacted by the migration
of customers and clients and their deposit and loan balances
between client-managed businesses, primarily CBB, CRES and
GWIM. Subsequent to the date of migration, the associated net
interest income, noninterest income and noninterest expense are
recorded in the business to which the customers or clients
migrated.
The Corporation’s ALM activities include an overall interest rate
risk management strategy that incorporates the use of various
derivatives and cash instruments to manage fluctuations in
earnings and capital that are caused by interest rate volatility. The
Corporation’s goal is to manage interest rate sensitivity so that
movements in interest rates do not significantly adversely affect
earnings and capital. The results of a majority of the Corporation’s
ALM activities are allocated to the business segments and
fluctuate based on the performance of the ALM activities. ALM
activities include external product pricing decisions including
deposit pricing strategies, the effects of the Corporation’s internal
funds transfer pricing process and the net effects of other ALM
activities.
Certain expenses not directly attributable to a specific
business segment are allocated to the segments. The most
significant of these expenses include data and item processing
costs and certain centralized or shared functions. Data processing
costs are allocated to the segments based on equipment usage.
Item processing costs are allocated to the segments based on
the volume of items processed for each segment. The costs of
certain other centralized or shared functions are allocated based
on methodologies that reflect utilization.