Bank of America 2013 Annual Report Download - page 176
Download and view the complete annual report
Please find page 176 of the 2013 Bank of America annual report below. You can navigate through the pages in the report by either clicking on the pages listed below, or by using the keyword search tool below to find specific information within the annual report.-
 1
1 -
2
-
3
-
4
-
5
-
6
-
7
-
8
-
9
-
10
-
11
-
12
-
13
-
14
-
15
-
16
-
17
-
18
-
19
-
20
-
21
-
22
-
23
-
24
-
25
-
26
-
27
-
28
-
29
-
30
-
31
-
32
-
33
-
34
-
35
-
36
-
37
-
38
-
39
-
40
-
41
-
42
-
43
-
44
-
45
-
46
-
47
-
48
-
49
-
50
-
51
-
52
-
53
-
54
-
55
-
56
-
57
-
58
-
59
-
60
-
61
-
62
-
63
-
64
-
65
-
66
-
67
-
68
-
69
-
70
-
71
-
72
-
73
-
74
-
75
-
76
-
77
-
78
-
79
-
80
-
81
-
82
-
83
-
84
-
85
-
86
-
87
-
88
-
89
-
90
-
91
-
92
-
93
-
94
-
95
-
96
-
97
-
98
-
99
-
100
-
101
-
102
-
103
-
104
-
105
-
106
-
107
-
108
-
109
-
110
-
111
-
112
-
113
-
114
-
115
-
116
-
117
-
118
-
119
-
120
-
121
-
122
-
123
-
124
-
125
-
126
-
127
-
128
-
129
-
130
-
131
-
132
-
133
-
134
-
135
-
136
-
137
-
138
-
139
-
140
-
141
-
142
-
143
-
144
-
145
-
146
-
147
-
148
-
149
-
150
-
151
-
152
-
153
-
154
-
155
-
156
-
157
-
158
-
159
-
160
-
161
-
162
-
163
-
164
-
165
-
 166
166 -
 167
167 -
 168
168 -
 169
169 -
 170
170 -
 171
171 -
 172
172 -
 173
173 -
 174
174 -
 175
175 -
 176
176 -
 177
177 -
 178
178 -
 179
179 -
 180
180 -
 181
181 -
 182
182 -
 183
183 -
 184
184 -
 185
185 -
 186
186 -
187
-
188
-
189
-
190
-
191
-
192
-
193
-
194
-
195
-
196
-
197
-
198
-
199
-
200
-
201
-
202
-
203
-
204
-
205
-
206
-
207
-
208
-
209
-
210
-
211
-
212
-
213
-
214
-
215
-
216
-
217
-
218
-
219
-
220
-
221
-
222
-
223
-
224
-
225
-
226
-
227
-
228
-
229
-
230
-
231
-
232
-
233
-
234
-
235
-
236
-
237
-
238
-
239
-
240
-
241
-
242
-
243
-
244
-
245
-
246
-
247
-
248
-
249
-
250
-
251
-
252
-
253
-
254
-
255
-
256
-
257
-
258
-
259
-
260
-
261
-
262
-
263
-
264
-
265
-
266
-
267
-
268
-
269
-
270
-
271
-
272
-
273
-
274
-
275
-
276
-
277
-
278
-
279
-
280
-
281
-
282
-
283
-
284
 |
 |

174 Bank of America 2013
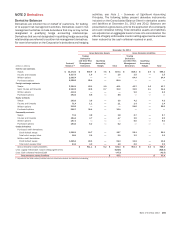
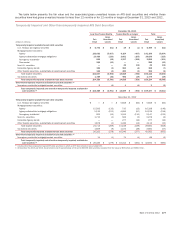
Valuation Adjustments on Derivatives
The Corporation records credit risk valuation adjustments on
derivatives in order to properly reflect the credit quality of the
counterparties and its own credit quality. The Corporation
calculates valuation adjustments on derivatives based on a
modeled expected exposure that incorporates current market risk
factors. The exposure also takes into consideration credit
mitigants such as enforceable master netting agreements and
collateral. CDS spread data is used to estimate the default
probabilities and severities that are applied to the exposures.
Where no observable credit default data is available for
counterparties, the Corporation uses proxies and other market
data to estimate default probabilities and severity.
Valuation adjustments on derivatives are affected by changes
in market spreads, non-credit related market factors such as
interest rate and currency changes that affect the expected
exposure, and other factors like changes in collateral
arrangements and partial payments. Credit spreads and non-credit
factors can move independently. For example, for an interest rate
swap, changes in interest rates may increase the expected
exposure which would increase the counterparty credit valuation
adjustment (CVA). Independently, counterparty credit spreads may
tighten, which would result in an offsetting decrease to CVA.
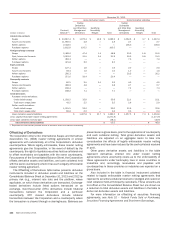
The Corporation may enter into risk management activities to
offset market driven exposures. The Corporation often hedges the
counterparty spread risk in CVA with CDS and often hedges the
other market risks in both CVA and DVA primarily with currency and
interest rate swaps. Since the components of the valuation
adjustments on derivatives move independently and the
Corporation may not hedge all of the market driven exposures, the
effect of a hedge may increase the gross valuation adjustments
on derivatives or may result in a gross positive valuation
adjustment on derivatives becoming a negative adjustment (or the
reverse).
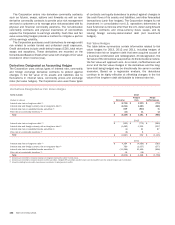
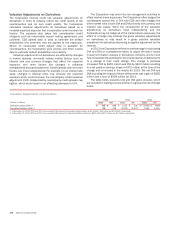
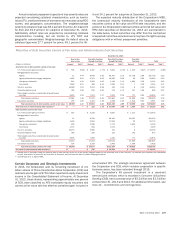
In 2013, the Corporation refined its methodology for calculating
CVA and DVA on a prospective basis, to adjust the way it values
mutual termination clauses in derivatives contracts and to more
fully incorporate the potential for the counterparties to default prior
to a change in their credit ratings. This change in estimate
increased CVA by $361 million and DVA by $433 million resulting
in a net positive earnings impact of $72 million at the time of the
change and is included in the results for 2013. The net CVA and
DVA excluding the impact of these refinements was a gain of $265
million and a loss of $508 million for 2013.
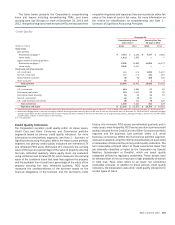
The table below presents CVA and DVA gains (losses), which
are recorded in trading account profits on a gross and net of hedge
basis.
Valuation Adjustments on Derivatives
2013 2012 2011
(Dollars in millions) Gross Net Gross Net Gross Net
Derivative assets (CVA) (1) $738 $(96)
$ 1,022 $ 291 $ (1,863) $ (606)
Derivative liabilities (DVA) (2) (39) (75) (2,212) (2,477) 1,385 1,000
(1) At December 31, 2013, 2012 and 2011, the cumulative CVA reduced the derivative assets balance by $1.6 billion, $2.4 billion and $2.8 billion, respectively.
(2) At December 31, 2013, 2012 and 2011, the cumulative DVA reduced the derivative liabilities balance by $803 million, $807 million and $2.4 billion, respectively.