Bank of America 2013 Annual Report Download - page 87
Download and view the complete annual report
Please find page 87 of the 2013 Bank of America annual report below. You can navigate through the pages in the report by either clicking on the pages listed below, or by using the keyword search tool below to find specific information within the annual report.-
 1
1 -
2
-
3
-
4
-
5
-
6
-
7
-
8
-
9
-
10
-
11
-
12
-
13
-
14
-
15
-
16
-
17
-
18
-
19
-
20
-
21
-
22
-
23
-
24
-
25
-
26
-
27
-
28
-
29
-
30
-
31
-
32
-
33
-
34
-
35
-
36
-
37
-
38
-
39
-
40
-
41
-
42
-
43
-
44
-
45
-
46
-
47
-
48
-
49
-
50
-
51
-
52
-
53
-
54
-
55
-
56
-
57
-
58
-
59
-
60
-
61
-
62
-
63
-
64
-
65
-
66
-
67
-
68
-
69
-
70
-
71
-
72
-
73
-
74
-
75
-
76
-
 77
77 -
 78
78 -
 79
79 -
 80
80 -
 81
81 -
 82
82 -
 83
83 -
 84
84 -
 85
85 -
 86
86 -
 87
87 -
 88
88 -
 89
89 -
 90
90 -
 91
91 -
 92
92 -
 93
93 -
 94
94 -
 95
95 -
 96
96 -
 97
97 -
98
-
99
-
100
-
101
-
102
-
103
-
104
-
105
-
106
-
107
-
108
-
109
-
110
-
111
-
112
-
113
-
114
-
115
-
116
-
117
-
118
-
119
-
120
-
121
-
122
-
123
-
124
-
125
-
126
-
127
-
128
-
129
-
130
-
131
-
132
-
133
-
134
-
135
-
136
-
137
-
138
-
139
-
140
-
141
-
142
-
143
-
144
-
145
-
146
-
147
-
148
-
149
-
150
-
151
-
152
-
153
-
154
-
155
-
156
-
157
-
158
-
159
-
160
-
161
-
162
-
163
-
164
-
165
-
166
-
167
-
168
-
169
-
170
-
171
-
172
-
173
-
174
-
175
-
176
-
177
-
178
-
179
-
180
-
181
-
182
-
183
-
184
-
185
-
186
-
187
-
188
-
189
-
190
-
191
-
192
-
193
-
194
-
195
-
196
-
197
-
198
-
199
-
200
-
201
-
202
-
203
-
204
-
205
-
206
-
207
-
208
-
209
-
210
-
211
-
212
-
213
-
214
-
215
-
216
-
217
-
218
-
219
-
220
-
221
-
222
-
223
-
224
-
225
-
226
-
227
-
228
-
229
-
230
-
231
-
232
-
233
-
234
-
235
-
236
-
237
-
238
-
239
-
240
-
241
-
242
-
243
-
244
-
245
-
246
-
247
-
248
-
249
-
250
-
251
-
252
-
253
-
254
-
255
-
256
-
257
-
258
-
259
-
260
-
261
-
262
-
263
-
264
-
265
-
266
-
267
-
268
-
269
-
270
-
271
-
272
-
273
-
274
-
275
-
276
-
277
-
278
-
279
-
280
-
281
-
282
-
283
-
284
 |
 |

Bank of America 2013 85
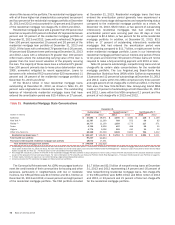
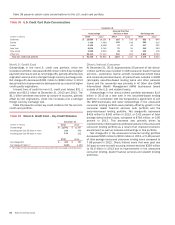
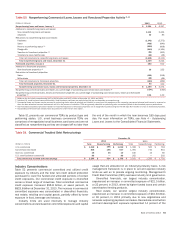
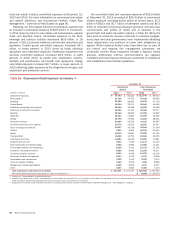
Table 40 presents certain state concentrations for the direct/indirect consumer loan portfolio.
Table 40 Direct/Indirect State Concentrations
December 31
Outstandings
Accruing Past Due
90 Days or More Net Charge-offs
(Dollars in millions) 2013 2012 2013 2012 2013 2012
California $ 10,041 $ 10,793 $57
$53
$42 $ 102
Texas 7,850 7,239 66 41 32 64
Florida 7,634 7,363 25 37 41 88
New York 4,611 4,794 33 28 20 43
Georgia 2,564 2,491 16 31 14 30
Other U.S./Non-U.S. 49,492 50,525 211 355 196 436
Total direct/indirect loan portfolio $ 82,192 $ 83,205 $408 $ 545 $345 $ 763
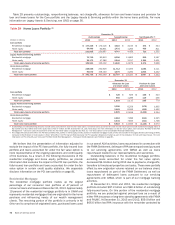
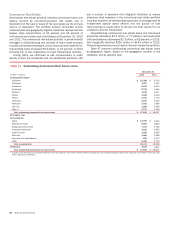
Other Consumer
At December 31, 2013, approximately 60 percent of the $2.0
billion other consumer portfolio was associated with certain
consumer finance businesses that we previously exited. The
remainder is primarily leases within the consumer dealer financial
services portfolio included in CBB.
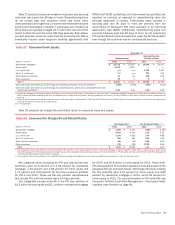
Consumer Loans Accounted for Under the Fair Value
Option
Outstanding consumer loans accounted for under the fair value
option totaled $2.2 billion at December 31, 2013 and were
comprised of residential mortgage loans that were previously
classified as held-for-sale, residential mortgage loans held in
consolidated variable interest entities (VIEs) and repurchases of
home equity loans. The loans that were previously classified as
held-for-sale were transferred to the residential mortgage portfolio
in connection with the decision to retain the loans. The fair value
option had been elected at the time of origination and the loans
continue to be measured at fair value after the reclassification. In
2013, we recorded net losses of $2 million resulting from changes
in the fair value of these loans, including gains of $41 million on
loans held in consolidated VIEs that were offset by losses recorded
on related long-term debt.
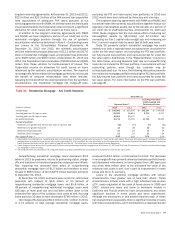
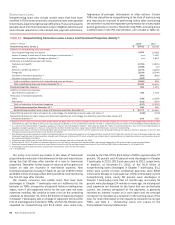
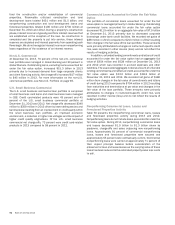
Nonperforming Consumer Loans, Leases and Foreclosed
Properties Activity
Table 41 presents nonperforming consumer loans, leases and
foreclosed properties activity during 2013 and 2012.
Nonperforming LHFS are excluded from nonperforming loans as
they are recorded at either fair value or the lower of cost or fair
value. Nonperforming loans do not include past due consumer
credit card loans, other unsecured loans and in general, consumer
non-real estate-secured loans (loans discharged in Chapter 7
bankruptcy are included) as these loans are typically charged off
no later than the end of the month in which the loan becomes
180 days past due. The charge-offs on these loans have no impact
on nonperforming activity and, accordingly, are excluded from this
table. The fully-insured loan portfolio is not reported as
nonperforming as principal repayment is insured. Additionally,
nonperforming loans do not include the PCI loan portfolio or loans
accounted for under the fair value option. For more information on
nonperforming loans, see Note 1 – Summary of Significant
Accounting Principles to the Consolidated Financial Statements.
During 2013, nonperforming consumer loans declined $3.6 billion
to $15.8 billion as outflows, including the impact of loan sales,
outpaced new inflows which continued to improve due to favorable
delinquency trends.
The outstanding balance of a real estate-secured loan that is
in excess of the estimated property value less costs to sell is
charged off no later than the end of the month in which the loan
becomes 180 days past due unless repayment of the loan is fully
insured. At December 31, 2013, $7.7 billion, or 47 percent of
nonperforming consumer real estate loans and foreclosed
properties had been written down to their estimated property value
less costs to sell, including $7.2 billion of nonperforming loans
180 days or more past due and $533 million of foreclosed
properties. In addition, at December 31, 2013, $5.9 billion, or 37
percent of nonperforming consumer loans were modified and are
now current after successful trial periods, or are current loans
classified as nonperforming loans in accordance with applicable
policies.
Foreclosed properties decreased $117 million in 2013 as
liquidations outpaced additions. PCI loans are excluded from
nonperforming loans as these loans were written down to fair value
at the acquisition date; however, once the underlying real estate
is acquired by the Corporation upon foreclosure of the delinquent
PCI loan, it is included in foreclosed properties. PCI-related
foreclosed properties increased $165 million in 2013. Not
included in foreclosed properties at December 31, 2013 was $1.4
billion of real estate that was acquired upon foreclosure of
delinquent FHA-insured loans. We hold this real estate on our
balance sheet until we convey these properties to the FHA. We
exclude these amounts from our nonperforming loans and
foreclosed properties activity as we expect we will be reimbursed
once the property is conveyed to the FHA for principal and, up to
certain limits, costs incurred during the foreclosure process and
interest incurred during the holding period. For more information
on the review of our foreclosure processes, see Off-Balance Sheet
Arrangements and Contractual Obligations – Servicing,
Foreclosure and Other Mortgage Matters on page 53.