Bank of America 2013 Annual Report Download - page 245
Download and view the complete annual report
Please find page 245 of the 2013 Bank of America annual report below. You can navigate through the pages in the report by either clicking on the pages listed below, or by using the keyword search tool below to find specific information within the annual report.-
 1
1 -
2
-
3
-
4
-
5
-
6
-
7
-
8
-
9
-
10
-
11
-
12
-
13
-
14
-
15
-
16
-
17
-
18
-
19
-
20
-
21
-
22
-
23
-
24
-
25
-
26
-
27
-
28
-
29
-
30
-
31
-
32
-
33
-
34
-
35
-
36
-
37
-
38
-
39
-
40
-
41
-
42
-
43
-
44
-
45
-
46
-
47
-
48
-
49
-
50
-
51
-
52
-
53
-
54
-
55
-
56
-
57
-
58
-
59
-
60
-
61
-
62
-
63
-
64
-
65
-
66
-
67
-
68
-
69
-
70
-
71
-
72
-
73
-
74
-
75
-
76
-
77
-
78
-
79
-
80
-
81
-
82
-
83
-
84
-
85
-
86
-
87
-
88
-
89
-
90
-
91
-
92
-
93
-
94
-
95
-
96
-
97
-
98
-
99
-
100
-
101
-
102
-
103
-
104
-
105
-
106
-
107
-
108
-
109
-
110
-
111
-
112
-
113
-
114
-
115
-
116
-
117
-
118
-
119
-
120
-
121
-
122
-
123
-
124
-
125
-
126
-
127
-
128
-
129
-
130
-
131
-
132
-
133
-
134
-
135
-
136
-
137
-
138
-
139
-
140
-
141
-
142
-
143
-
144
-
145
-
146
-
147
-
148
-
149
-
150
-
151
-
152
-
153
-
154
-
155
-
156
-
157
-
158
-
159
-
160
-
161
-
162
-
163
-
164
-
165
-
166
-
167
-
168
-
169
-
170
-
171
-
172
-
173
-
174
-
175
-
176
-
177
-
178
-
179
-
180
-
181
-
182
-
183
-
184
-
185
-
186
-
187
-
188
-
189
-
190
-
191
-
192
-
193
-
194
-
195
-
196
-
197
-
198
-
199
-
200
-
201
-
202
-
203
-
204
-
205
-
206
-
207
-
208
-
209
-
210
-
211
-
212
-
213
-
214
-
215
-
216
-
217
-
218
-
219
-
220
-
221
-
222
-
223
-
224
-
225
-
226
-
227
-
228
-
229
-
230
-
231
-
232
-
233
-
234
-
 235
235 -
 236
236 -
 237
237 -
 238
238 -
 239
239 -
 240
240 -
 241
241 -
 242
242 -
 243
243 -
 244
244 -
 245
245 -
 246
246 -
 247
247 -
 248
248 -
 249
249 -
 250
250 -
 251
251 -
 252
252 -
 253
253 -
 254
254 -
 255
255 -
256
-
257
-
258
-
259
-
260
-
261
-
262
-
263
-
264
-
265
-
266
-
267
-
268
-
269
-
270
-
271
-
272
-
273
-
274
-
275
-
276
-
277
-
278
-
279
-
280
-
281
-
282
-
283
-
284
 |
 |

Bank of America 2013 243
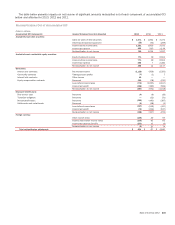
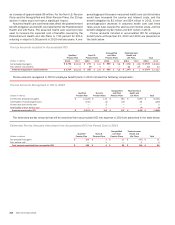
Pension Plans with ABO and PBO in excess of plan assets as of December 31, 2013 and 2012 are presented in the table below.
For the non-qualified plans not subject to ERISA or non-U.S. pension plans, funding strategies vary due to legal requirements and local
practices.
Plans with ABO and PBO in Excess of Plan Assets
Qualified
Pension Plan
Non-U.S.
Pension Plans
Nonqualified
and Other
Pension Plans
(Dollars in millions) 2013 2012 2013 2012 2013 2012
Plans with ABO in excess of plan assets
PBO n/a $ 7,171 $617 $ 883 $ 1,129 $ 1,182
ABO n/a 7,171 606 843 1,126 1,181
Fair value of plan assets n/a 7,114 290 510 22
Plans with PBO in excess of plan assets
PBO n/a $ 7,171 $720 $ 896 $ 1,129 $ 1,182
Fair value of plan assets n/a 7,114 392 522 22
n/a = not applicable
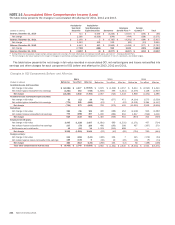
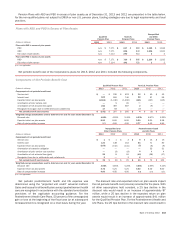
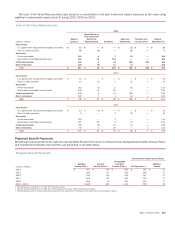
Net periodic benefit cost of the Corporation’s plans for 2013, 2012 and 2011 included the following components.
Components of Net Periodic Benefit Cost
Qualified Pension Plan Non-U.S. Pension Plans
(Dollars in millions) 2013 2012 2011 2013 2012 2011
Components of net periodic benefit cost
Service cost $—
$ 236 $ 423 $32 $40$43
Interest cost 623 681 746 98 97 99
Expected return on plan assets (1,024)(1,246) (1,296) (121)(137) (115)
Amortization of prior service cost —920 ———
Amortization of net actuarial loss (gain) 242 469 387 2(9) —
Recognized loss (gain) due to settlements and curtailments 17 58 — (7)——
Net periodic benefit cost (income) $ (142) $ 207 $ 280 $4
$(9)$
27
Weighted-average assumptions used to determine net cost for years ended December 31
Discount rate 4.00%4.95% 5.45% 4.23%4.87% 5.32%
Expected return on plan assets 6.50 8.00 8.00 5.50 6.65 6.58
Rate of compensation increase n/a 4.00 4.00 4.37 4.42 4.85
Nonqualified and
Other Pension Plans
Postretirement Health
and Life Plans
(Dollars in millions) 2013 2012 2011 2013 2012 2011
Components of net periodic benefit cost
Service cost $1
$1$3
$9
$13$15
Interest cost 120 138 152 54 71 80
Expected return on plan assets (109) (152) (141) (5)(8) (9)
Amortization of transition obligation ————32 31
Amortization of prior service cost (credits) —(3) (8) 444
Amortization of net actuarial loss (gain) 25 816
(42) (38) (17)
Recognized loss due to settlements and curtailments 2—36——
Net periodic benefit cost (income) $ 39 $(8)$25
$26 $ 74 $ 104
Weighted-average assumptions used to determine net cost for years ended December 31
Discount rate 3.65%4.65% 5.20% 3.65%4.65% 5.10%
Expected return on plan assets 3.75 5.25 5.25 6.50 8.00 8.00
Rate of compensation increase 4.00 4.00 4.00 n/a n/a n/a
n/a = not applicable
Net periodic postretirement health and life expense was
determined using the “projected unit credit” actuarial method.
Gains and losses for all benefit plans except postretirement health
care are recognized in accordance with the standard amortization
provisions of the applicable accounting guidance. For the
Postretirement Health Care Plans, 50 percent of the unrecognized
gain or loss at the beginning of the fiscal year (or at subsequent
remeasurement) is recognized on a level basis during the year.
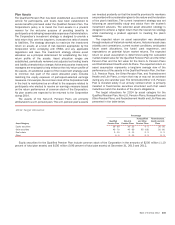
The discount rate and expected return on plan assets impact
the net periodic benefit cost (income) recorded for the plans. With
all other assumptions held constant, a 25 bps decline in the
discount rate would result in an increase of approximately $7
million, while a 25 bps decline in the expected return on plan
assets would result in an increase of approximately $41 million
for the Qualified Pension Plan. For the Postretirement Health and
Life Plans, the 25 bps decline in the discount rate would result in