Bank of America 2013 Annual Report Download - page 88
Download and view the complete annual report
Please find page 88 of the 2013 Bank of America annual report below. You can navigate through the pages in the report by either clicking on the pages listed below, or by using the keyword search tool below to find specific information within the annual report.-
 1
1 -
2
-
3
-
4
-
5
-
6
-
7
-
8
-
9
-
10
-
11
-
12
-
13
-
14
-
15
-
16
-
17
-
18
-
19
-
20
-
21
-
22
-
23
-
24
-
25
-
26
-
27
-
28
-
29
-
30
-
31
-
32
-
33
-
34
-
35
-
36
-
37
-
38
-
39
-
40
-
41
-
42
-
43
-
44
-
45
-
46
-
47
-
48
-
49
-
50
-
51
-
52
-
53
-
54
-
55
-
56
-
57
-
58
-
59
-
60
-
61
-
62
-
63
-
64
-
65
-
66
-
67
-
68
-
69
-
70
-
71
-
72
-
73
-
74
-
75
-
76
-
77
-
 78
78 -
 79
79 -
 80
80 -
 81
81 -
 82
82 -
 83
83 -
 84
84 -
 85
85 -
 86
86 -
 87
87 -
 88
88 -
 89
89 -
 90
90 -
 91
91 -
 92
92 -
 93
93 -
 94
94 -
 95
95 -
 96
96 -
 97
97 -
 98
98 -
99
-
100
-
101
-
102
-
103
-
104
-
105
-
106
-
107
-
108
-
109
-
110
-
111
-
112
-
113
-
114
-
115
-
116
-
117
-
118
-
119
-
120
-
121
-
122
-
123
-
124
-
125
-
126
-
127
-
128
-
129
-
130
-
131
-
132
-
133
-
134
-
135
-
136
-
137
-
138
-
139
-
140
-
141
-
142
-
143
-
144
-
145
-
146
-
147
-
148
-
149
-
150
-
151
-
152
-
153
-
154
-
155
-
156
-
157
-
158
-
159
-
160
-
161
-
162
-
163
-
164
-
165
-
166
-
167
-
168
-
169
-
170
-
171
-
172
-
173
-
174
-
175
-
176
-
177
-
178
-
179
-
180
-
181
-
182
-
183
-
184
-
185
-
186
-
187
-
188
-
189
-
190
-
191
-
192
-
193
-
194
-
195
-
196
-
197
-
198
-
199
-
200
-
201
-
202
-
203
-
204
-
205
-
206
-
207
-
208
-
209
-
210
-
211
-
212
-
213
-
214
-
215
-
216
-
217
-
218
-
219
-
220
-
221
-
222
-
223
-
224
-
225
-
226
-
227
-
228
-
229
-
230
-
231
-
232
-
233
-
234
-
235
-
236
-
237
-
238
-
239
-
240
-
241
-
242
-
243
-
244
-
245
-
246
-
247
-
248
-
249
-
250
-
251
-
252
-
253
-
254
-
255
-
256
-
257
-
258
-
259
-
260
-
261
-
262
-
263
-
264
-
265
-
266
-
267
-
268
-
269
-
270
-
271
-
272
-
273
-
274
-
275
-
276
-
277
-
278
-
279
-
280
-
281
-
282
-
283
-
284
 |
 |

86 Bank of America 2013
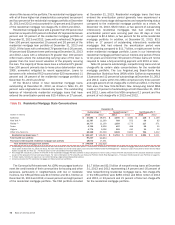
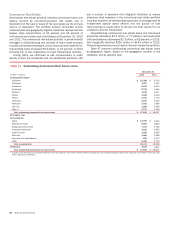
Restructured Loans
Nonperforming loans also include certain loans that have been
modified in TDRs where economic concessions have been granted
to borrowers experiencing financial difficulties. These concessions
typically result from the Corporation’s loss mitigation activities and
could include reductions in the interest rate, payment extensions,
forgiveness of principal, forbearance or other actions. Certain
TDRs are classified as nonperforming at the time of restructuring
and may only be returned to performing status after considering
the borrower’s sustained repayment performance for a reasonable
period, generally six months. Nonperforming TDRs, excluding those
modified loans in the PCI loan portfolio, are included in Table 41.
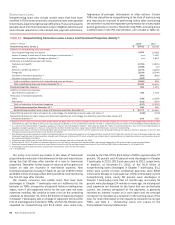
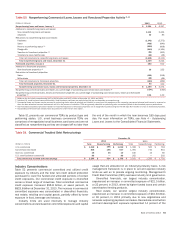
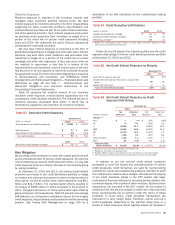
Table 41 Nonperforming Consumer Loans, Leases and Foreclosed Properties Activity (1)
(Dollars in millions) 2013 2012
Nonperforming loans, January 1 $ 19,431 $ 18,768
Additions to nonperforming loans and leases:
New nonperforming loans and leases 9,652 13,084
Impact of change in treatment of loans discharged in bankruptcies (2) n/a 1,162
Implementation of regulatory interagency guidance (2) n/a 1,853
Reductions to nonperforming loans and leases:
Paydowns and payoffs (2,782)(3,801)
Sales (1,528)(47)
Returns to performing status (3) (4,273)(4,203)
Charge-offs (3,514)(6,544)
Transfers to foreclosed properties (4) (483)(841)
Transfers to loans held-for-sale (5) (663)—
Total net additions (reductions) to nonperforming loans and leases (3,591)663
Total nonperforming loans and leases, December 31 (6) 15,840 19,431
Foreclosed properties, January 1 650 1,991
Additions to foreclosed properties:
New foreclosed properties (4) 936 1,129
Reductions to foreclosed properties:
Sales (930)(2,283)
Write-downs (123)(187)
Total net reductions to foreclosed properties (117)(1,341)
Total foreclosed properties, December 31 (7) 533 650
Nonperforming consumer loans, leases and foreclosed properties, December 31 $ 16,373 $ 20,081
Nonperforming consumer loans and leases as a percentage of outstanding consumer loans and leases (8) 2.99%3.52%
Nonperforming consumer loans, leases and foreclosed properties as a percentage of outstanding consumer loans, leases and
foreclosed properties (8) 3.09 3.63
(1) Balances do not include nonperforming LHFS of $376 million and $622 million and nonaccruing TDRs removed from the PCI loan portfolio prior to January 1, 2010 of $260 million and $521 million
at December 31, 2013 and 2012 as well as loans accruing past due 90 days or more as presented in Table 27 and Note 4 – Outstanding Loans and Leases to the Consolidated Financial Statements.
(2) As a result of the implementation of regulatory guidance in 2012 on loans discharged in Chapter 7 bankruptcy, we added $1.2 billion to nonperforming loans. As a result of the implementation of
regulatory interagency guidance in 2012, we reclassified $1.9 billion of performing home equity loans (of which $1.6 billion were current) to nonperforming.
(3) Consumer loans may be returned to performing status when all principal and interest is current and full repayment of the remaining contractual principal and interest is expected, or when the loan
otherwise becomes well-secured and is in the process of collection.
(4) New foreclosed properties represents transfers of nonperforming loans to foreclosed properties net of charge-offs taken during the first 90 days after transfer of a loan to foreclosed properties. New
foreclosed properties also includes properties obtained upon foreclosure of delinquent PCI loans, properties repurchased due to representations and warranties exposure and properties acquired
with newly consolidated subsidiaries.
(5) Transfers to loans held-for-sale includes $273 million of loans that were sold prior to December 31, 2013.
(6) At December 31, 2013, 46 percent of nonperforming loans were 180 days or more past due and were written down through charge-offs to 65 percent of their unpaid principal balance.
(7) Foreclosed property balances do not include loans that are insured by the FHA and have entered foreclosure of $1.4 billion and $2.5 billion at December 31, 2013 and 2012.
(8) Outstanding consumer loans and leases exclude loans accounted for under the fair value option.
n/a = not applicable
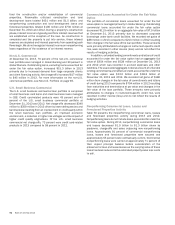
Our policy is to record any losses in the value of foreclosed
properties as a reduction in the allowance for loan and lease losses
during the first 90 days after transfer of a loan to foreclosed
properties. Thereafter, further losses in value as well as gains and
losses on sale are recorded in noninterest expense. New
foreclosed properties included in Table 41 are net of $190 million
and $261 million of charge-offs in 2013 and 2012, recorded during
the first 90 days after transfer.
We classify consumer real estate loans that have been
discharged in Chapter 7 bankruptcy and not reaffirmed by the
borrower as TDRs, irrespective of payment history or delinquency
status, even if the repayment terms for the loan have not been
otherwise modified. We continue to have a lien on the underlying
collateral. At December 31, 2013, $3.6 billion of loans discharged
in Chapter 7 bankruptcy with no change in repayment terms at the
time of discharge were included in TDRs, of which $1.8 billion were
classified as nonperforming and $1.8 billion were loans fully-
insured by the FHA. Of the $3.6 billion of TDRs, approximately 27
percent, 30 percent and 43 percent were discharged in Chapter
7 bankruptcy in 2013, 2012 and years prior to 2012, respectively.
In addition, at December 31, 2013, of the $1.8 billion of
nonperforming loans discharged in Chapter 7 bankruptcy, $1.1
billion were current on their contractual payments while $642
million were 90 days or more past due. Of the contractually current
nonperforming loans, nearly 80 percent were discharged in
Chapter 7 bankruptcy more than 12 months ago, and nearly 50
percent were discharged 24 months or more ago. As subsequent
cash payments are received on the loans that are contractually
current, the interest component of the payments is generally
recorded as interest income on a cash basis and the principal
component is recorded as a reduction in the carrying value of the
loan. For more information on the impacts to consumer home loan
TDRs, see Note 4 – Outstanding Loans and Leases to the
Consolidated Financial Statements.