Bank of America 2013 Annual Report Download - page 263
Download and view the complete annual report
Please find page 263 of the 2013 Bank of America annual report below. You can navigate through the pages in the report by either clicking on the pages listed below, or by using the keyword search tool below to find specific information within the annual report.-
 1
1 -
2
-
3
-
4
-
5
-
6
-
7
-
8
-
9
-
10
-
11
-
12
-
13
-
14
-
15
-
16
-
17
-
18
-
19
-
20
-
21
-
22
-
23
-
24
-
25
-
26
-
27
-
28
-
29
-
30
-
31
-
32
-
33
-
34
-
35
-
36
-
37
-
38
-
39
-
40
-
41
-
42
-
43
-
44
-
45
-
46
-
47
-
48
-
49
-
50
-
51
-
52
-
53
-
54
-
55
-
56
-
57
-
58
-
59
-
60
-
61
-
62
-
63
-
64
-
65
-
66
-
67
-
68
-
69
-
70
-
71
-
72
-
73
-
74
-
75
-
76
-
77
-
78
-
79
-
80
-
81
-
82
-
83
-
84
-
85
-
86
-
87
-
88
-
89
-
90
-
91
-
92
-
93
-
94
-
95
-
96
-
97
-
98
-
99
-
100
-
101
-
102
-
103
-
104
-
105
-
106
-
107
-
108
-
109
-
110
-
111
-
112
-
113
-
114
-
115
-
116
-
117
-
118
-
119
-
120
-
121
-
122
-
123
-
124
-
125
-
126
-
127
-
128
-
129
-
130
-
131
-
132
-
133
-
134
-
135
-
136
-
137
-
138
-
139
-
140
-
141
-
142
-
143
-
144
-
145
-
146
-
147
-
148
-
149
-
150
-
151
-
152
-
153
-
154
-
155
-
156
-
157
-
158
-
159
-
160
-
161
-
162
-
163
-
164
-
165
-
166
-
167
-
168
-
169
-
170
-
171
-
172
-
173
-
174
-
175
-
176
-
177
-
178
-
179
-
180
-
181
-
182
-
183
-
184
-
185
-
186
-
187
-
188
-
189
-
190
-
191
-
192
-
193
-
194
-
195
-
196
-
197
-
198
-
199
-
200
-
201
-
202
-
203
-
204
-
205
-
206
-
207
-
208
-
209
-
210
-
211
-
212
-
213
-
214
-
215
-
216
-
217
-
218
-
219
-
220
-
221
-
222
-
223
-
224
-
225
-
226
-
227
-
228
-
229
-
230
-
231
-
232
-
233
-
234
-
235
-
236
-
237
-
238
-
239
-
240
-
241
-
242
-
243
-
244
-
245
-
246
-
247
-
248
-
249
-
250
-
251
-
252
-
 253
253 -
 254
254 -
 255
255 -
 256
256 -
 257
257 -
 258
258 -
 259
259 -
 260
260 -
 261
261 -
 262
262 -
 263
263 -
 264
264 -
 265
265 -
 266
266 -
 267
267 -
 268
268 -
 269
269 -
 270
270 -
 271
271 -
 272
272 -
 273
273 -
274
-
275
-
276
-
277
-
278
-
279
-
280
-
281
-
282
-
283
-
284
 |
 |

Bank of America 2013 261
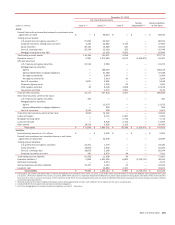
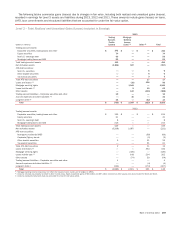
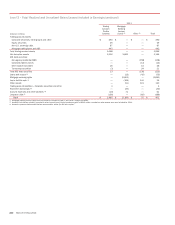
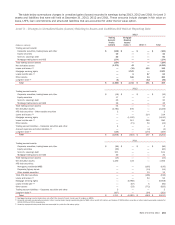
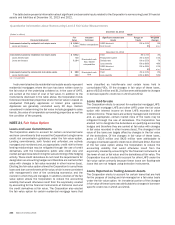
The table below summarizes changes in unrealized gains (losses) recorded in earnings during 2013, 2012 and 2011 for Level 3
assets and liabilities that were still held at December 31, 2013, 2012 and 2011. These amounts include changes in fair value on
loans, LHFS, loan commitments and structured liabilities that are accounted for under the fair value option.
Level 3 – Changes in Unrealized Gains (Losses) Relating to Assets and Liabilities Still Held at Reporting Date
2013
(Dollars in millions)
Trading
Account
Profits
(Losses)
Mortgage
Banking
Income
(Loss) (1) Other (2) Total
Trading account assets:
Corporate securities, trading loans and other $ (130) $ — $ —$ (130)
Equity securities 40 — —40
Non-U.S. sovereign debt 80 — —80
Mortgage trading loans and ABS (174) — —(174)
Total trading account assets (184) — —(184)
Net derivative assets (1,375)42 —(1,333)
Loans and leases (3) —(34)
152 118
Mortgage servicing rights — 1,541 —1,541
Loans held-for-sale (3) —6
57 63
Other assets —166 14 180
Long-term debt (3) (4) — (32) (36)
Total $(1,563) $ 1,721 $ 191 $ 349
2012
Trading account assets:
Corporate securities, trading loans and other $ (19) $ — $ — $ (19)
Equity securities 17 — — 17
Non-U.S. sovereign debt 20 — — 20
Mortgage trading loans and ABS 36 — — 36
Total trading account assets 54 — — 54
Net derivative assets (2,782) 456 — (2,326)
AFS debt securities – Other taxable securities 2 — — 2
Loans and leases (3) — — 214 214
Mortgage servicing rights — (1,100) — (1,100)
Loans held-for-sale (3) — 112 168 280
Other assets — (71) 50 (21)
Trading account liabilities – Corporate securities and other 4 — — 4
Accrued expenses and other liabilities (3) —— (2)(2)
Long-term debt (3) (136) — (173) (309)
Total $ (2,858) $ (603) $ 257 $ (3,204)
2011
Trading account assets:
Corporate securities, trading loans and other $ (86) $ — $ — $ (86)
Equity securities (60) — — (60)
Non-U.S. sovereign debt 101 — — 101
Mortgage trading loans and ABS 30 — — 30
Total trading account assets (15) — — (15)
Net derivative assets 1,430 133 — 1,563
AFS debt securities:
Non-agency residential MBS — — (195) (195)
Corporate/Agency bonds — — (14) (14)
Other taxable securities — — 13 13
Total AFS debt securities — — (196) (196)
Loans and leases (3) — — 94 94
Mortgage servicing rights — (6,958) — (6,958)
Loans held-for-sale (3) — (87) 5 (82)
Other assets — (53) (772) (825)
Trading account liabilities – Corporate securities and other 3 — — 3
Long-term debt (3) (107) — (94) (201)
Total $ 1,311 $ (6,965) $ (963) $ (6,617)
(1) Mortgage banking income (loss) does not reflect the impact of Level 1 and Level 2 hedges on MSRs.
(2) Amounts included are primarily recorded in other income (loss). Equity investment gains of $60 million and $141 million, and losses of $309 million recorded on other assets were also included for
2013, 2012 and 2011, respectively.
(3) Amounts represent instruments that are accounted for under the fair value option.