Bank of America 2013 Annual Report Download - page 67
Download and view the complete annual report
Please find page 67 of the 2013 Bank of America annual report below. You can navigate through the pages in the report by either clicking on the pages listed below, or by using the keyword search tool below to find specific information within the annual report.-
 1
1 -
2
-
3
-
4
-
5
-
6
-
7
-
8
-
9
-
10
-
11
-
12
-
13
-
14
-
15
-
16
-
17
-
18
-
19
-
20
-
21
-
22
-
23
-
24
-
25
-
26
-
27
-
28
-
29
-
30
-
31
-
32
-
33
-
34
-
35
-
36
-
37
-
38
-
39
-
40
-
41
-
42
-
43
-
44
-
45
-
46
-
47
-
48
-
49
-
50
-
51
-
52
-
53
-
54
-
55
-
56
-
 57
57 -
 58
58 -
 59
59 -
 60
60 -
 61
61 -
 62
62 -
 63
63 -
 64
64 -
 65
65 -
 66
66 -
 67
67 -
 68
68 -
 69
69 -
 70
70 -
 71
71 -
 72
72 -
 73
73 -
 74
74 -
 75
75 -
 76
76 -
 77
77 -
78
-
79
-
80
-
81
-
82
-
83
-
84
-
85
-
86
-
87
-
88
-
89
-
90
-
91
-
92
-
93
-
94
-
95
-
96
-
97
-
98
-
99
-
100
-
101
-
102
-
103
-
104
-
105
-
106
-
107
-
108
-
109
-
110
-
111
-
112
-
113
-
114
-
115
-
116
-
117
-
118
-
119
-
120
-
121
-
122
-
123
-
124
-
125
-
126
-
127
-
128
-
129
-
130
-
131
-
132
-
133
-
134
-
135
-
136
-
137
-
138
-
139
-
140
-
141
-
142
-
143
-
144
-
145
-
146
-
147
-
148
-
149
-
150
-
151
-
152
-
153
-
154
-
155
-
156
-
157
-
158
-
159
-
160
-
161
-
162
-
163
-
164
-
165
-
166
-
167
-
168
-
169
-
170
-
171
-
172
-
173
-
174
-
175
-
176
-
177
-
178
-
179
-
180
-
181
-
182
-
183
-
184
-
185
-
186
-
187
-
188
-
189
-
190
-
191
-
192
-
193
-
194
-
195
-
196
-
197
-
198
-
199
-
200
-
201
-
202
-
203
-
204
-
205
-
206
-
207
-
208
-
209
-
210
-
211
-
212
-
213
-
214
-
215
-
216
-
217
-
218
-
219
-
220
-
221
-
222
-
223
-
224
-
225
-
226
-
227
-
228
-
229
-
230
-
231
-
232
-
233
-
234
-
235
-
236
-
237
-
238
-
239
-
240
-
241
-
242
-
243
-
244
-
245
-
246
-
247
-
248
-
249
-
250
-
251
-
252
-
253
-
254
-
255
-
256
-
257
-
258
-
259
-
260
-
261
-
262
-
263
-
264
-
265
-
266
-
267
-
268
-
269
-
270
-
271
-
272
-
273
-
274
-
275
-
276
-
277
-
278
-
279
-
280
-
281
-
282
-
283
-
284
 |
 |

Bank of America 2013 65
Changes to the composition of regulatory capital under Basel
3, such as recognizing the impact of unrealized gains or losses
on AFS debt securities in Tier 1 common capital, are subject to a
transition period where the impact is recognized in 20 percent
annual increments. These regulatory capital adjustments and
deductions will be fully implemented in 2018. The phase-in period
for the new minimum capital ratio requirements and related buffers
under Basel 3 is from January 1, 2014 through December 31,
2018. When presented on a fully phased-in basis, capital, risk-
weighted assets and the capital ratios assume all regulatory
capital adjustments and deductions are fully recognized.
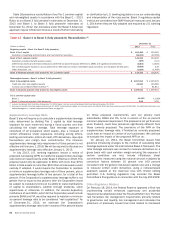
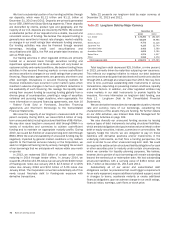
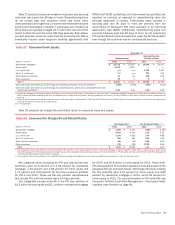
Table 17 summarizes how certain regulatory capital deductions
and adjustments will be transitioned from 2014 through 2018 for
Tier 1 common and Tier 1 capital.
Table 17 Summary of Certain Basel 3 Regulatory Capital Transition Provisions
Beginning on January 1 of each year 2014 2015 2016 2017 2018
Tier 1 common capital
Percent of total amount deducted from Tier 1 common capital includes: 20% 40% 60% 80% 100%
Deferred tax assets arising from net operating loss and tax credit carryforwards; intangibles, other than mortgage servicing rights and goodwill; defined benefit pension
fund net assets; net gains (losses) related to changes in own credit risk on liabilities, including derivatives, measured at fair value; direct and indirect investments
in own Tier 1 common capital instruments; certain amounts exceeding the threshold by 10 percent individually and 15 percent in aggregate
Percent of total amount used to adjust Tier 1 common capital includes (1): 80% 60% 40% 20% 0%
Net unrealized gains (losses) on AFS debt and certain marketable equity securities recorded in accumulated OCI; employee benefit plan adjustments recorded in
accumulated OCI
Tier 1 capital
Percent of total amount deducted from Tier 1 capital includes: 80% 60% 40% 20% 0%
Deferred tax assets arising from net operating loss and tax credit carryforwards; defined benefit pension fund net assets; net gains (losses) related to changes in own
credit risk on liabilities, including derivatives, measured at fair value
(1) Represents the phase-out percentage of the exclusion by year (e.g., 20 percent of net unrealized gains (losses) on AFS debt and certain marketable equity securities recorded in accumulated OCI
will be included in 2014).
In addition, Basel 3 revised the regulatory capital treatment for
Trust Securities, requiring them to be partially transitioned from
Tier 1 capital into Tier 2 capital in 2014 and 2015, until fully
excluded from Tier 1 capital in 2016, and partially transitioned
and excluded from Tier 2 capital beginning in 2016. The exclusion
from Tier 2 capital starts at 40 percent on January 1, 2016,
increasing 10 percent each year until the full amount is excluded
from Tier 2 capital beginning on January 1, 2022. As of
December 31, 2013, our qualifying Trust Securities were $5.8
billion (approximately 45 bps of Tier 1 capital) and will no longer
qualify as Tier 1 capital or Tier 2 capital beginning in 2016, subject
to the transition provisions previously described.
Standardized Approach
The Basel 3 Standardized approach measures risk-weighted
assets primarily for market risk and credit risk exposures.
Exposures subject to market risk, as defined under the rules, are
measured on the same basis as the Market Risk Final Rule,
described previously. Credit risk exposures are measured by
applying fixed risk weights to the exposure, determined based on
the characteristics of the exposure, such as type of obligor,
Organization for Economic Cooperation and Development (OECD)
country risk code and maturity, among others. Under the
Standardized approach, no distinction is made for variations in
credit quality for corporate exposures, and the economic benefit
of collateral is restricted to a limited list of eligible securities and
cash. Some key differences between the Standardized and
Advanced approaches are that the Advanced approach includes a
measure of operational risk and a credit valuation adjustment
(CVA) capital charge in credit risk and relies on internal analytical
models to measure credit risk-weighted assets, as more fully
described below. Under the Basel 3 Standardized approach, we
estimate our Tier 1 common capital ratio, on a fully phased-in
basis, to be just above nine percent at December 31, 2013.
Advanced Approach
Under the Basel 3 Advanced approach, risk-weighted assets are
determined primarily for market risk, credit risk and operational
risk. Market risk capital measurements are consistent with the
Standardized approach, except for securitization exposures, where
the Supervisory Formula Approach is also permitted, and certain
differences arising from the inclusion of the CVA capital charge in
the credit risk capital measurement. Credit risk exposures are
measured using advanced internal ratings-based models to
determine the applicable risk weight by estimating the probability
of default, loss-given default (LGD) and, in certain instances,
exposure at default (EAD). The analytical models primarily rely on
internal historical default and loss experience. Operational risk is
measured using advanced internal models which rely on both
internal and external operational loss experience and data. The
Basel 3 Advanced approach requires approval by the U.S.
regulatory agencies of our internal analytical models used to
calculate risk-weighted assets. If these models are not approved,
it would likely lead to an increase in our risk-weighted assets, which
in some cases could be significant.
Prior to calculating and assessing capital adequacy and
reporting regulatory capital ratios using Basel 3 Advanced
approach risk-weighted assets, we must receive notification of
approval to do so from the U.S banking regulators. Under the Basel
3 Advanced approach, we estimated our Tier 1 common capital
ratio, on a fully phased-in basis, to be 9.96 percent at
December 31, 2013. As of December 31, 2013, we estimated
that our Tier 1 common capital would be $132.3 billion and total
risk-weighted assets would be $1,329 billion, on a fully phased-
in basis. This assumes approval by U.S. banking regulators of our
internal analytical models, but does not include the benefit of the
removal of the surcharge applicable to the Comprehensive Risk
Measure (CRM). The calculations under Basel 3 require
management to make estimates, assumptions and interpre-
tations, including the probability of future events based on
historical experience. Realized results could differ from those
estimates and assumptions.