Bank of America 2013 Annual Report Download - page 43
Download and view the complete annual report
Please find page 43 of the 2013 Bank of America annual report below. You can navigate through the pages in the report by either clicking on the pages listed below, or by using the keyword search tool below to find specific information within the annual report.-
 1
1 -
2
-
3
-
4
-
5
-
6
-
7
-
8
-
9
-
10
-
11
-
12
-
13
-
14
-
15
-
16
-
17
-
18
-
19
-
20
-
21
-
22
-
23
-
24
-
25
-
26
-
27
-
28
-
29
-
30
-
31
-
32
-
 33
33 -
 34
34 -
 35
35 -
 36
36 -
 37
37 -
 38
38 -
 39
39 -
 40
40 -
 41
41 -
 42
42 -
 43
43 -
 44
44 -
 45
45 -
 46
46 -
 47
47 -
 48
48 -
 49
49 -
 50
50 -
 51
51 -
 52
52 -
 53
53 -
54
-
55
-
56
-
57
-
58
-
59
-
60
-
61
-
62
-
63
-
64
-
65
-
66
-
67
-
68
-
69
-
70
-
71
-
72
-
73
-
74
-
75
-
76
-
77
-
78
-
79
-
80
-
81
-
82
-
83
-
84
-
85
-
86
-
87
-
88
-
89
-
90
-
91
-
92
-
93
-
94
-
95
-
96
-
97
-
98
-
99
-
100
-
101
-
102
-
103
-
104
-
105
-
106
-
107
-
108
-
109
-
110
-
111
-
112
-
113
-
114
-
115
-
116
-
117
-
118
-
119
-
120
-
121
-
122
-
123
-
124
-
125
-
126
-
127
-
128
-
129
-
130
-
131
-
132
-
133
-
134
-
135
-
136
-
137
-
138
-
139
-
140
-
141
-
142
-
143
-
144
-
145
-
146
-
147
-
148
-
149
-
150
-
151
-
152
-
153
-
154
-
155
-
156
-
157
-
158
-
159
-
160
-
161
-
162
-
163
-
164
-
165
-
166
-
167
-
168
-
169
-
170
-
171
-
172
-
173
-
174
-
175
-
176
-
177
-
178
-
179
-
180
-
181
-
182
-
183
-
184
-
185
-
186
-
187
-
188
-
189
-
190
-
191
-
192
-
193
-
194
-
195
-
196
-
197
-
198
-
199
-
200
-
201
-
202
-
203
-
204
-
205
-
206
-
207
-
208
-
209
-
210
-
211
-
212
-
213
-
214
-
215
-
216
-
217
-
218
-
219
-
220
-
221
-
222
-
223
-
224
-
225
-
226
-
227
-
228
-
229
-
230
-
231
-
232
-
233
-
234
-
235
-
236
-
237
-
238
-
239
-
240
-
241
-
242
-
243
-
244
-
245
-
246
-
247
-
248
-
249
-
250
-
251
-
252
-
253
-
254
-
255
-
256
-
257
-
258
-
259
-
260
-
261
-
262
-
263
-
264
-
265
-
266
-
267
-
268
-
269
-
270
-
271
-
272
-
273
-
274
-
275
-
276
-
277
-
278
-
279
-
280
-
281
-
282
-
283
-
284
 |
 |

Bank of America 2013 41
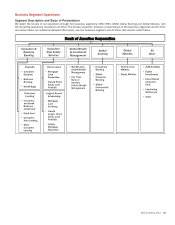
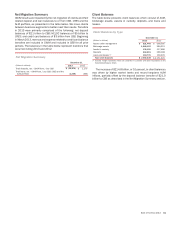
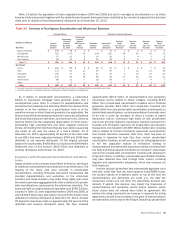
Net Migration Summary
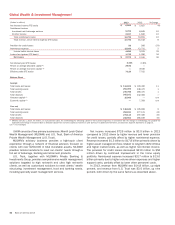
GWIM results are impacted by the net migration of clients and their
related deposit and loan balances to or from CBB, CRES and the
ALM portfolio, as presented in the table below. We move clients
between business segments to better meet their needs. Transfers
in 2013 were primarily comprised of the following: net deposit
balances of $21 billion to CBB; HELOC balances of $5 billion to
CRES; and credit card balances of $3 billion from CBB. Beginning
in March 2013, revenue and expense related to credit card balance
transfers are included in GWIM and included in CBB for all prior
periods. The balances in the table below represent transfers that
occurred during 2013 and 2012.
Net Migration Summary
December 31
(Dollars in millions) 2013 2012
Total deposits, net – GWIM from / (to) CBB $ (20,974) $ 1,170
Total loans, net – GWIM from / (to) CBB, CRES and the
ALM portfolio (1,356) (335)
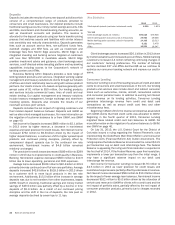
Client Balances
The table below presents client balances which consist of AUM,
brokerage assets, assets in custody, deposits, and loans and
leases.
Client Balances by Type
December 31
(Dollars in millions) 2013 2012
Assets under management $ 821,449 $ 698,095
Brokerage assets 1,045,122 960,351
Assets in custody 136,190 117,686
Deposits 244,901 266,188
Loans and leases (1) 118,776 109,305
Total client balances $ 2,366,438 $ 2,151,625
(1) Includes margin receivables which are classified in customer and other receivables on the
Consolidated Balance Sheet.
The increase of $214.8 billion, or 10 percent, in client balances
was driven by higher market levels and record long-term AUM
inflows, partially offset by the deposit balance transfer of $21.0
billion to CBB as described in the Net Migration Summary section.