Bank of America 2013 Annual Report Download - page 44
Download and view the complete annual report
Please find page 44 of the 2013 Bank of America annual report below. You can navigate through the pages in the report by either clicking on the pages listed below, or by using the keyword search tool below to find specific information within the annual report.-
 1
1 -
2
-
3
-
4
-
5
-
6
-
7
-
8
-
9
-
10
-
11
-
12
-
13
-
14
-
15
-
16
-
17
-
18
-
19
-
20
-
21
-
22
-
23
-
24
-
25
-
26
-
27
-
28
-
29
-
30
-
31
-
32
-
33
-
 34
34 -
 35
35 -
 36
36 -
 37
37 -
 38
38 -
 39
39 -
 40
40 -
 41
41 -
 42
42 -
 43
43 -
 44
44 -
 45
45 -
 46
46 -
 47
47 -
 48
48 -
 49
49 -
 50
50 -
 51
51 -
 52
52 -
 53
53 -
 54
54 -
55
-
56
-
57
-
58
-
59
-
60
-
61
-
62
-
63
-
64
-
65
-
66
-
67
-
68
-
69
-
70
-
71
-
72
-
73
-
74
-
75
-
76
-
77
-
78
-
79
-
80
-
81
-
82
-
83
-
84
-
85
-
86
-
87
-
88
-
89
-
90
-
91
-
92
-
93
-
94
-
95
-
96
-
97
-
98
-
99
-
100
-
101
-
102
-
103
-
104
-
105
-
106
-
107
-
108
-
109
-
110
-
111
-
112
-
113
-
114
-
115
-
116
-
117
-
118
-
119
-
120
-
121
-
122
-
123
-
124
-
125
-
126
-
127
-
128
-
129
-
130
-
131
-
132
-
133
-
134
-
135
-
136
-
137
-
138
-
139
-
140
-
141
-
142
-
143
-
144
-
145
-
146
-
147
-
148
-
149
-
150
-
151
-
152
-
153
-
154
-
155
-
156
-
157
-
158
-
159
-
160
-
161
-
162
-
163
-
164
-
165
-
166
-
167
-
168
-
169
-
170
-
171
-
172
-
173
-
174
-
175
-
176
-
177
-
178
-
179
-
180
-
181
-
182
-
183
-
184
-
185
-
186
-
187
-
188
-
189
-
190
-
191
-
192
-
193
-
194
-
195
-
196
-
197
-
198
-
199
-
200
-
201
-
202
-
203
-
204
-
205
-
206
-
207
-
208
-
209
-
210
-
211
-
212
-
213
-
214
-
215
-
216
-
217
-
218
-
219
-
220
-
221
-
222
-
223
-
224
-
225
-
226
-
227
-
228
-
229
-
230
-
231
-
232
-
233
-
234
-
235
-
236
-
237
-
238
-
239
-
240
-
241
-
242
-
243
-
244
-
245
-
246
-
247
-
248
-
249
-
250
-
251
-
252
-
253
-
254
-
255
-
256
-
257
-
258
-
259
-
260
-
261
-
262
-
263
-
264
-
265
-
266
-
267
-
268
-
269
-
270
-
271
-
272
-
273
-
274
-
275
-
276
-
277
-
278
-
279
-
280
-
281
-
282
-
283
-
284
 |
 |

42 Bank of America 2013
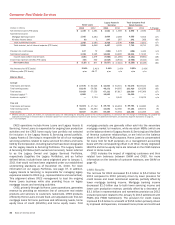
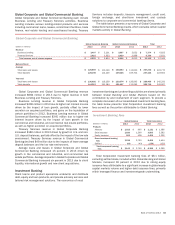
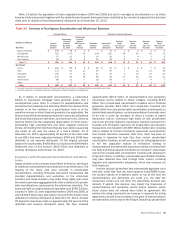
Global Banking
(Dollars in millions) 2013 2012 % Change
Net interest income (FTE basis) $ 8,914 $ 8,135 10%
Noninterest income:
Service charges 2,787 2,867 (3)
Investment banking fees 3,235 2,793 16
All other income 1,545 1,879 (18)
Total noninterest income 7,567 7,539 —
Total revenue, net of interest expense (FTE basis) 16,481 15,674 5
Provision for credit losses 1,075 (342) n/m
Noninterest expense 7,552 7,619 (1)
Income before income taxes 7,854 8,397 (6)
Income tax expense (FTE basis) 2,880 3,053 (6)
Net income $ 4,974 $ 5,344 (7)
Net interest yield (FTE basis) 2.96%2.90%
Return on average allocated capital (1) 21.64 —
Return on average economic capital (1) —27.69
Efficiency ratio (FTE basis) 45.82 48.61
Balance Sheet
Average
Total loans and leases $ 257,245 $ 224,336 15
Total earning assets 301,204 280,605 7
Total assets 343,464 322,701 6
Total deposits 237,457 223,940 6
Allocated equity (1) 23,000 — n/m
Economic capital (1) —19,312 n/m
Year end
Total loans and leases $ 269,469 $ 242,340 11
Total earning assets 337,154 288,072 17
Total assets 379,207 331,611 14
Total deposits 265,718 243,306 9
(1) Effective January 1, 2013, we revised, on a prospective basis, the methodology for allocating capital to the business segments. In connection with the change in methodology, we updated the
applicable terminology in the above table to allocated capital from economic capital as reported in prior periods. For additional information, see Business Segment Operations on page 31.
n/m = not meaningful
Global Banking, which includes Global Corporate and Global
Commercial Banking, and Investment Banking, provides a wide
range of lending-related products and services, integrated working
capital management and treasury solutions to clients, and
underwriting and advisory services through our network of offices
and client relationship teams. Our lending products and services
include commercial loans, leases, commitment facilities, trade
finance, real estate lending and asset-based lending. Our treasury
solutions business includes treasury management, foreign
exchange and short-term investing options. We also work with our
clients to provide investment banking products such as debt and
equity underwriting and distribution, and merger-related and other
advisory services. Underwriting debt and equity issuances, fixed-
income and equity research, and certain market-based activities
are executed through our global broker/dealer affiliates which are
our primary dealers in several countries. Within Global Banking,
Global Commercial Banking clients generally include middle-
market companies, commercial real estate firms, auto dealerships
and not-for-profit companies. Global Corporate Banking includes
large global corporations, financial institutions and leasing clients.
During 2013, consumer DFS results were moved to CBB from
Global Banking to align this business more closely with our
consumer lending activity and better serve the needs of our
customers. Prior periods were reclassified to conform to current
period presentation.
Net income for Global Banking decreased $370 million to $5.0
billion in 2013 compared to 2012 primarily driven by an increase
in the provision for credit losses, partially offset by higher revenue.
Revenue increased $807 million to $16.5 billion in 2013 as higher
net interest income due to the impact of loan growth and higher
investment banking fees were partially offset by lower other income
due to gains on the liquidation of certain portfolios in 2012.
The provision for credit losses increased $1.4 billion to $1.1
billion in 2013 compared to a benefit of $342 million in 2012
primarily due to increased reserves as a result of commercial loan
growth.
Noninterest expense of $7.6 billion remained relatively
unchanged in 2013 primarily due to lower personnel expense as
we continue to streamline our business operations and achieve
cost savings, largely offset by higher litigation expense.