Bank of America 2013 Annual Report Download - page 83
Download and view the complete annual report
Please find page 83 of the 2013 Bank of America annual report below. You can navigate through the pages in the report by either clicking on the pages listed below, or by using the keyword search tool below to find specific information within the annual report.-
 1
1 -
2
-
3
-
4
-
5
-
6
-
7
-
8
-
9
-
10
-
11
-
12
-
13
-
14
-
15
-
16
-
17
-
18
-
19
-
20
-
21
-
22
-
23
-
24
-
25
-
26
-
27
-
28
-
29
-
30
-
31
-
32
-
33
-
34
-
35
-
36
-
37
-
38
-
39
-
40
-
41
-
42
-
43
-
44
-
45
-
46
-
47
-
48
-
49
-
50
-
51
-
52
-
53
-
54
-
55
-
56
-
57
-
58
-
59
-
60
-
61
-
62
-
63
-
64
-
65
-
66
-
67
-
68
-
69
-
70
-
71
-
72
-
 73
73 -
 74
74 -
 75
75 -
 76
76 -
 77
77 -
 78
78 -
 79
79 -
 80
80 -
 81
81 -
 82
82 -
 83
83 -
 84
84 -
 85
85 -
 86
86 -
 87
87 -
 88
88 -
 89
89 -
 90
90 -
 91
91 -
 92
92 -
 93
93 -
94
-
95
-
96
-
97
-
98
-
99
-
100
-
101
-
102
-
103
-
104
-
105
-
106
-
107
-
108
-
109
-
110
-
111
-
112
-
113
-
114
-
115
-
116
-
117
-
118
-
119
-
120
-
121
-
122
-
123
-
124
-
125
-
126
-
127
-
128
-
129
-
130
-
131
-
132
-
133
-
134
-
135
-
136
-
137
-
138
-
139
-
140
-
141
-
142
-
143
-
144
-
145
-
146
-
147
-
148
-
149
-
150
-
151
-
152
-
153
-
154
-
155
-
156
-
157
-
158
-
159
-
160
-
161
-
162
-
163
-
164
-
165
-
166
-
167
-
168
-
169
-
170
-
171
-
172
-
173
-
174
-
175
-
176
-
177
-
178
-
179
-
180
-
181
-
182
-
183
-
184
-
185
-
186
-
187
-
188
-
189
-
190
-
191
-
192
-
193
-
194
-
195
-
196
-
197
-
198
-
199
-
200
-
201
-
202
-
203
-
204
-
205
-
206
-
207
-
208
-
209
-
210
-
211
-
212
-
213
-
214
-
215
-
216
-
217
-
218
-
219
-
220
-
221
-
222
-
223
-
224
-
225
-
226
-
227
-
228
-
229
-
230
-
231
-
232
-
233
-
234
-
235
-
236
-
237
-
238
-
239
-
240
-
241
-
242
-
243
-
244
-
245
-
246
-
247
-
248
-
249
-
250
-
251
-
252
-
253
-
254
-
255
-
256
-
257
-
258
-
259
-
260
-
261
-
262
-
263
-
264
-
265
-
266
-
267
-
268
-
269
-
270
-
271
-
272
-
273
-
274
-
275
-
276
-
277
-
278
-
279
-
280
-
281
-
282
-
283
-
284
 |
 |

Bank of America 2013 81
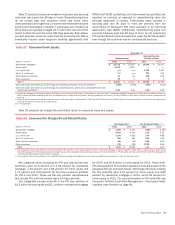
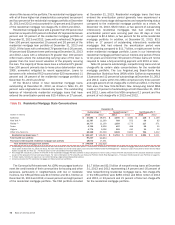
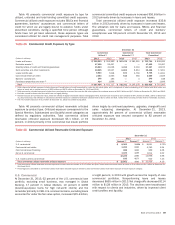
Table 33 presents outstandings, nonperforming balances and
net charge-offs by certain state concentrations for the home equity
portfolio. In the New York area, the New York-Northern New Jersey-
Long Island MSA made up 12 percent and 11 percent of the
outstanding home equity portfolio at December 31, 2013 and
2012. Loans within this MSA comprised nine percent and eight
percent of net charge-offs in 2013 and 2012. The Los Angeles-
Long Beach-Santa Ana MSA within California made up 12 percent
of the outstanding home equity portfolio at both December 31,
2013 and 2012. Loans within this MSA comprised nine percent
and 11 percent of net charge-offs in 2013 and 2012.
For more information on representations and warranties related
to our home equity portfolio, see Off-Balance Sheet Arrangements
and Contractual Obligations – Representations and Warranties on
page 48 and Note 7 – Representations and Warranties Obligations
and Corporate Guarantees to the Consolidated Financial
Statements.
Table 33 Home Equity State Concentrations
December 31
Outstandings (1) Nonperforming (1) Net Charge-offs (2)
(Dollars in millions) 2013 2012 2013 2012 2013 2012
California $ 25,061 $ 28,730 $ 1,047 $ 1,128 $509 $ 1,333
Florida (3) 10,604 11,899 643 706 315 602
New Jersey (3) 6,153 6,789 304 312 93 210
New York (3) 6,035 6,736 405 419 110 222
Massachusetts 3,881 4,381 144 140 42 91
Other U.S./Non-U.S. 35,345 40,938 1,532 1,577 734 1,784
Home equity loans (4) $ 87,079 $ 99,473 $ 4,075 $ 4,282 $ 1,803 $ 4,242
Purchased credit-impaired home equity portfolio 6,593 8,667
Total home equity loan portfolio $ 93,672 $108,140
(1) Outstandings and nonperforming amounts exclude loans accounted for under the fair value option. There were $147 million of home equity loans accounted for under the fair value option at
December 31, 2013 compared to none at December 31, 2012. For more information on the fair value option, see Consumer Portfolio Credit Risk Management – Consumer Loans Accounted for
Under the Fair Value Option on page 85 and Note 21 – Fair Value Option to the Consolidated Financial Statements.
(2) Net charge-offs exclude $1.2 billion of write-offs in the home equity PCI loan portfolio in 2013 compared to $2.8 billion in 2012. These write-offs decreased the PCI valuation allowance included as
part of the allowance for loan and lease losses. For more information on PCI write-offs, see Consumer Portfolio Credit Risk Management – Purchased Credit-impaired Loan Portfolio on page 81.
(3) In these states, foreclosure requires a court order following a legal proceeding (judicial states).
(4) Amount excludes the PCI home equity portfolio.
Purchased Credit-impaired Loan Portfolio
Loans acquired with evidence of credit quality deterioration since
origination and for which it is probable at purchase that we will be
unable to collect all contractually required payments are accounted
for under the accounting guidance for PCI loans, which addresses
accounting for differences between contractual and expected cash
flows to be collected from the purchaser’s initial investment in
loans if those differences are attributable, at least in part, to credit
quality. Evidence of credit quality deterioration as of the acquisition
date may include statistics such as past due status, refreshed
FICO scores and refreshed LTVs. PCI loans are recorded at fair
value upon acquisition and the applicable accounting guidance
prohibits carrying over or recording a valuation allowance in the
initial accounting.
PCI loans that have similar risk characteristics, primarily credit
risk, collateral type and interest rate risk, are pooled and accounted
for as a single asset with a single composite interest rate and an
aggregate expectation of cash flows. Once a pool is assembled,
it is treated as if it were one loan for purposes of applying the
accounting guidance for PCI loans. An individual loan is removed
from a PCI loan pool if it is sold, foreclosed, forgiven or the
expectation of any future proceeds is remote. When a loan is
removed from a PCI loan pool and the foreclosure or recovery value
of the loan is less than the loan’s carrying value, the difference is
first applied against the PCI pool’s nonaccretable difference. If the
nonaccretable difference has been fully utilized, only then is the
PCI pool’s basis applicable to that loan written-off against its
valuation reserve; however, the integrity of the pool is maintained
and it continues to be accounted for as if it were one loan.
In 2013, in connection with the FNMA Settlement, we
repurchased certain residential mortgage loans that had
previously been sold to FNMA, which we have valued at less than
the purchase price. As of December 31, 2013, loans repurchased
in connection with the FNMA Settlement that we classified as PCI
had an unpaid principal balance of $5.3 billion and a carrying value
of $4.6 billion. For additional information, see Note 7 –
Representations and Warranties Obligations and Corporate
Guarantees to the Consolidated Financial Statements.