Bank of America 2013 Annual Report Download - page 155
Download and view the complete annual report
Please find page 155 of the 2013 Bank of America annual report below. You can navigate through the pages in the report by either clicking on the pages listed below, or by using the keyword search tool below to find specific information within the annual report.-
 1
1 -
2
-
3
-
4
-
5
-
6
-
7
-
8
-
9
-
10
-
11
-
12
-
13
-
14
-
15
-
16
-
17
-
18
-
19
-
20
-
21
-
22
-
23
-
24
-
25
-
26
-
27
-
28
-
29
-
30
-
31
-
32
-
33
-
34
-
35
-
36
-
37
-
38
-
39
-
40
-
41
-
42
-
43
-
44
-
45
-
46
-
47
-
48
-
49
-
50
-
51
-
52
-
53
-
54
-
55
-
56
-
57
-
58
-
59
-
60
-
61
-
62
-
63
-
64
-
65
-
66
-
67
-
68
-
69
-
70
-
71
-
72
-
73
-
74
-
75
-
76
-
77
-
78
-
79
-
80
-
81
-
82
-
83
-
84
-
85
-
86
-
87
-
88
-
89
-
90
-
91
-
92
-
93
-
94
-
95
-
96
-
97
-
98
-
99
-
100
-
101
-
102
-
103
-
104
-
105
-
106
-
107
-
108
-
109
-
110
-
111
-
112
-
113
-
114
-
115
-
116
-
117
-
118
-
119
-
120
-
121
-
122
-
123
-
124
-
125
-
126
-
127
-
128
-
129
-
130
-
131
-
132
-
133
-
134
-
135
-
136
-
137
-
138
-
139
-
140
-
141
-
142
-
143
-
144
-
 145
145 -
 146
146 -
 147
147 -
 148
148 -
 149
149 -
 150
150 -
 151
151 -
 152
152 -
 153
153 -
 154
154 -
 155
155 -
 156
156 -
 157
157 -
 158
158 -
 159
159 -
 160
160 -
 161
161 -
 162
162 -
 163
163 -
 164
164 -
 165
165 -
166
-
167
-
168
-
169
-
170
-
171
-
172
-
173
-
174
-
175
-
176
-
177
-
178
-
179
-
180
-
181
-
182
-
183
-
184
-
185
-
186
-
187
-
188
-
189
-
190
-
191
-
192
-
193
-
194
-
195
-
196
-
197
-
198
-
199
-
200
-
201
-
202
-
203
-
204
-
205
-
206
-
207
-
208
-
209
-
210
-
211
-
212
-
213
-
214
-
215
-
216
-
217
-
218
-
219
-
220
-
221
-
222
-
223
-
224
-
225
-
226
-
227
-
228
-
229
-
230
-
231
-
232
-
233
-
234
-
235
-
236
-
237
-
238
-
239
-
240
-
241
-
242
-
243
-
244
-
245
-
246
-
247
-
248
-
249
-
250
-
251
-
252
-
253
-
254
-
255
-
256
-
257
-
258
-
259
-
260
-
261
-
262
-
263
-
264
-
265
-
266
-
267
-
268
-
269
-
270
-
271
-
272
-
273
-
274
-
275
-
276
-
277
-
278
-
279
-
280
-
281
-
282
-
283
-
284
 |
 |

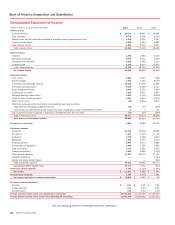
Bank of America 2013 153
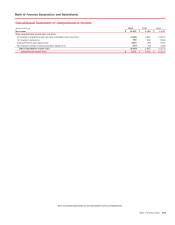
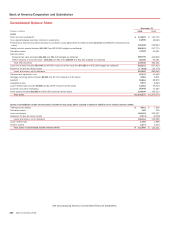
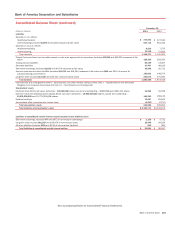
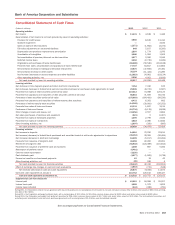
Bank of America Corporation and Subsidiaries
Consolidated Statement of Cash Flows
(Dollars in millions) 2013 2012 2011
Operating activities
Net income $ 11,431 $ 4,188 $ 1,446
Reconciliation of net income to net cash provided by (used in) operating activities:
Provision for credit losses 3,556 8,169 13,410
Goodwill impairment —— 3,184
Gains on sales of debt securities (1,271)(1,662) (3,374)
Fair value adjustments on structured liabilities 649 5,107 (3,320)
Depreciation and premises improvements amortization 1,597 1,774 1,976
Amortization of intangibles 1,086 1,264 1,509
Net amortization of premium/discount on debt securities 1,577 2,580 2,046
Deferred income taxes 3,262 (2,735) (1,949)
Originations and purchases of loans held-for-sale (65,688) (59,540) (118,168)
Proceeds from sales, securitizations and paydowns of loans held-for-sale 77,707 54,817 141,862
Net (increase) decrease in trading and derivative instruments 33,870 (47,606) 25,481
Net (increase) decrease in other assets 35,154 (11,424) 21,285
Net increase (decrease) in accrued expenses and other liabilities (12,919) 24,061 (18,124)
Other operating activities, net 2,806 4,951 (2,816)
Net cash provided by (used in) operating activities 92,817 (16,056) 64,448
Investing activities
Net decrease in time deposits placed and other short-term investments 7,154 7,310 105
Net (increase) decrease in federal funds sold and securities borrowed or purchased under agreements to resell 29,596 (8,741) (1,567)
Proceeds from sales of debt securities carried at fair value 119,013 74,068 120,125
Proceeds from paydowns and maturities of debt securities carried at fair value 85,554 71,509 56,732
Purchases of debt securities carried at fair value (175,983) (164,491) (99,536)
Proceeds from paydowns and maturities of held-to-maturity debt securities 8,472 6,261 602
Purchases of held-to-maturity debt securities (14,388) (20,991) (35,552)
Proceeds from sales of loans and leases 12,331 1,837 3,124
Purchases of loans and leases (16,734) (9,178) (9,638)
Other changes in loans and leases, net (34,256) 2,557 2,864
Net sales (purchases) of premises and equipment (521) 5 (1,307)
Proceeds from sales of foreclosed properties 1,099 2,799 2,532
Proceeds from sales of investments 4,818 2,396 14,840
Other investing activities, net (1,097)(320) (895)
Net cash provided by (used in) investing activities 25,058 (34,979) 52,429
Financing activities
Net increase in deposits 14,010 72,220 22,611
Net increase (decrease) in federal funds purchased and securities loaned or sold under agreements to repurchase (95,153) 78,395 (30,495)
Net increase (decrease) in short-term borrowings 16,009 (5,017) (24,264)
Proceeds from issuance of long-term debt 45,658 22,200 26,001
Retirement of long-term debt (65,602) (124,389) (101,814)
Proceeds from issuance of preferred stock and warrants 1,008 667 5,000
Redemption of preferred stock (6,461)——
Common stock repurchased (3,220)——
Cash dividends paid (1,677)(1,909) (1,738)
Excess tax benefits on share-based payments 12 13 42
Other financing activities, net (26) 236 3
Net cash provided by (used in) financing activities (95,442) 42,416 (104,654)
Effect of exchange rate changes on cash and cash equivalents (1,863)(731) (548)
Net increase (decrease) in cash and cash equivalents 20,570 (9,350) 11,675
Cash and cash equivalents at January 1 110,752 120,102 108,427
Cash and cash equivalents at December 31 $ 131,322 $110,752 $ 120,102
Supplemental cash flow disclosures
Interest paid $ 12,912 $ 18,268 $ 25,207
Income taxes paid 1,559 1,372 1,653
Income taxes refunded (244) (338) (781)
During 2011, the Corporation entered into an agreement with Assured Guaranty Ltd. and subsidiaries which resulted in non-cash increases to loans of $2.2 billion, other assets of $82 million and long-
term debt of $2.3 billion.
During 2011, the Corporation exchanged preferred stock, with a carrying value of $1.1 billion, for 92 million common shares valued at $522 million and senior notes valued at $360 million.
During 2011, the Corporation exchanged trust preferred securities for 308 million common shares valued at $1.7 billion and senior notes valued at $2.0 billion. The trust preferred securities, and
underlying junior subordinated notes and stock purchase agreements, with a carrying value of $5.2 billion, were immediately canceled.
See accompanying Notes to Consolidated Financial Statements.