Bank of America 2013 Annual Report Download - page 213
Download and view the complete annual report
Please find page 213 of the 2013 Bank of America annual report below. You can navigate through the pages in the report by either clicking on the pages listed below, or by using the keyword search tool below to find specific information within the annual report.-
 1
1 -
2
-
3
-
4
-
5
-
6
-
7
-
8
-
9
-
10
-
11
-
12
-
13
-
14
-
15
-
16
-
17
-
18
-
19
-
20
-
21
-
22
-
23
-
24
-
25
-
26
-
27
-
28
-
29
-
30
-
31
-
32
-
33
-
34
-
35
-
36
-
37
-
38
-
39
-
40
-
41
-
42
-
43
-
44
-
45
-
46
-
47
-
48
-
49
-
50
-
51
-
52
-
53
-
54
-
55
-
56
-
57
-
58
-
59
-
60
-
61
-
62
-
63
-
64
-
65
-
66
-
67
-
68
-
69
-
70
-
71
-
72
-
73
-
74
-
75
-
76
-
77
-
78
-
79
-
80
-
81
-
82
-
83
-
84
-
85
-
86
-
87
-
88
-
89
-
90
-
91
-
92
-
93
-
94
-
95
-
96
-
97
-
98
-
99
-
100
-
101
-
102
-
103
-
104
-
105
-
106
-
107
-
108
-
109
-
110
-
111
-
112
-
113
-
114
-
115
-
116
-
117
-
118
-
119
-
120
-
121
-
122
-
123
-
124
-
125
-
126
-
127
-
128
-
129
-
130
-
131
-
132
-
133
-
134
-
135
-
136
-
137
-
138
-
139
-
140
-
141
-
142
-
143
-
144
-
145
-
146
-
147
-
148
-
149
-
150
-
151
-
152
-
153
-
154
-
155
-
156
-
157
-
158
-
159
-
160
-
161
-
162
-
163
-
164
-
165
-
166
-
167
-
168
-
169
-
170
-
171
-
172
-
173
-
174
-
175
-
176
-
177
-
178
-
179
-
180
-
181
-
182
-
183
-
184
-
185
-
186
-
187
-
188
-
189
-
190
-
191
-
192
-
193
-
194
-
195
-
196
-
197
-
198
-
199
-
200
-
201
-
202
-
 203
203 -
 204
204 -
 205
205 -
 206
206 -
 207
207 -
 208
208 -
 209
209 -
 210
210 -
 211
211 -
 212
212 -
 213
213 -
 214
214 -
 215
215 -
 216
216 -
 217
217 -
 218
218 -
 219
219 -
 220
220 -
 221
221 -
 222
222 -
 223
223 -
224
-
225
-
226
-
227
-
228
-
229
-
230
-
231
-
232
-
233
-
234
-
235
-
236
-
237
-
238
-
239
-
240
-
241
-
242
-
243
-
244
-
245
-
246
-
247
-
248
-
249
-
250
-
251
-
252
-
253
-
254
-
255
-
256
-
257
-
258
-
259
-
260
-
261
-
262
-
263
-
264
-
265
-
266
-
267
-
268
-
269
-
270
-
271
-
272
-
273
-
274
-
275
-
276
-
277
-
278
-
279
-
280
-
281
-
282
-
283
-
284
 |
 |

Bank of America 2013 211
extended to non-monoline contexts, it could significantly impact
the Corporation’s provision and/or the estimated range of possible
loss. Additionally, if court rulings, including one related to the
Corporation, that have allowed sampling of loan files instead of
requiring a loan-by-loan review to determine if a representations
and warranties breach has occurred, are followed generally by the
courts, private-label securitization counterparties may view
litigation as a more attractive alternative compared to a loan-by-
loan review. Finally, although the Corporation believes that the
representations and warranties typically given in non-GSE
transactions are less rigorous and actionable than those given in
GSE transactions, the Corporation does not have significant
experience resolving loan-level claims in non-GSE transactions to
measure the impact of these differences on the probability that a
loan will be required to be repurchased.
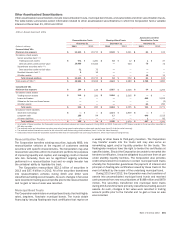
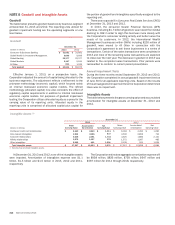
Cash Payments
The table below presents first-lien and home equity loan
repurchases and indemnification payments for 2013 and 2012.
During 2013 and 2012, the Corporation paid $1.2 billion and $1.8
billion to resolve $1.5 billion and $2.1 billion of repurchase claims
through repurchase or reimbursement to the investor or
securitization trust for losses they incurred, resulting in a loss on
the related loans at the time of repurchase or reimbursement of
$609 million and $847 million. Cash paid for loan repurchases
includes the unpaid principal balance of the loan plus past due
interest. The amount of loss for loan repurchases is reduced by
the fair value of the underlying loan collateral. The repurchase of
loans and indemnification payments related to first-lien and home
equity repurchase claims generally resulted from material
breaches of representations and warranties related to the loans’
material compliance with the applicable underwriting standards,
including borrower misrepresentation, credit exceptions without
sufficient compensating factors and non-compliance with
underwriting procedures. The actual representations and
warranties made in a sales transaction and the resulting
repurchase and indemnification activity can vary by transaction or
investor. A direct relationship between the type of defect that
causes the breach of representations and warranties and the
severity of the realized loss has not been observed. Transactions
to repurchase loans or make indemnification payments related to
first-lien residential mortgages primarily involved the GSEs while
transactions to repurchase loans or make indemnification
payments for home equity loans primarily involved the monoline
insurers. The amounts in the table below exclude a cash payment
of $391 million paid to FHLMC for the FHLMC Settlement. The
amounts in the table also exclude a cash payment of $3.6 billion
made in 2013 to FNMA and the repurchase for $6.6 billion of
certain residential mortgage loans which the Corporation valued
at less than the purchase price, both of which were part of the
FNMA Settlement. Additionally, the amounts shown in the table
below exclude $1.8 billion and $669 million paid in monoline
settlements during 2013 and 2012.
Loan Repurchases and Indemnification Payments
December 31
2013 2012
(Dollars in millions)
Unpaid
Principal
Balance
Cash Paid
for
Repurchases Loss
Unpaid
Principal
Balance
Cash Paid
for
Repurchases Loss
First-lien
Repurchases $ 746 $ 784 $149 $ 1,184 $ 1,273 $ 389
Indemnification payments 661 383 383 831 425 425
Total first-lien 1,407 1,167 532 2,015 1,698 814
Home equity
Repurchases ———
24 24 —
Indemnification payments 74 77 77 36 33 33
Total home equity 74 77 77 60 57 33
Total first-lien and home equity $ 1,481 $ 1,244 $ 609 $ 2,075 $ 1,755 $ 847