Bank of America 2013 Annual Report Download - page 215
Download and view the complete annual report
Please find page 215 of the 2013 Bank of America annual report below. You can navigate through the pages in the report by either clicking on the pages listed below, or by using the keyword search tool below to find specific information within the annual report.-
 1
1 -
2
-
3
-
4
-
5
-
6
-
7
-
8
-
9
-
10
-
11
-
12
-
13
-
14
-
15
-
16
-
17
-
18
-
19
-
20
-
21
-
22
-
23
-
24
-
25
-
26
-
27
-
28
-
29
-
30
-
31
-
32
-
33
-
34
-
35
-
36
-
37
-
38
-
39
-
40
-
41
-
42
-
43
-
44
-
45
-
46
-
47
-
48
-
49
-
50
-
51
-
52
-
53
-
54
-
55
-
56
-
57
-
58
-
59
-
60
-
61
-
62
-
63
-
64
-
65
-
66
-
67
-
68
-
69
-
70
-
71
-
72
-
73
-
74
-
75
-
76
-
77
-
78
-
79
-
80
-
81
-
82
-
83
-
84
-
85
-
86
-
87
-
88
-
89
-
90
-
91
-
92
-
93
-
94
-
95
-
96
-
97
-
98
-
99
-
100
-
101
-
102
-
103
-
104
-
105
-
106
-
107
-
108
-
109
-
110
-
111
-
112
-
113
-
114
-
115
-
116
-
117
-
118
-
119
-
120
-
121
-
122
-
123
-
124
-
125
-
126
-
127
-
128
-
129
-
130
-
131
-
132
-
133
-
134
-
135
-
136
-
137
-
138
-
139
-
140
-
141
-
142
-
143
-
144
-
145
-
146
-
147
-
148
-
149
-
150
-
151
-
152
-
153
-
154
-
155
-
156
-
157
-
158
-
159
-
160
-
161
-
162
-
163
-
164
-
165
-
166
-
167
-
168
-
169
-
170
-
171
-
172
-
173
-
174
-
175
-
176
-
177
-
178
-
179
-
180
-
181
-
182
-
183
-
184
-
185
-
186
-
187
-
188
-
189
-
190
-
191
-
192
-
193
-
194
-
195
-
196
-
197
-
198
-
199
-
200
-
201
-
202
-
203
-
204
-
 205
205 -
 206
206 -
 207
207 -
 208
208 -
 209
209 -
 210
210 -
 211
211 -
 212
212 -
 213
213 -
 214
214 -
 215
215 -
 216
216 -
 217
217 -
 218
218 -
 219
219 -
 220
220 -
 221
221 -
 222
222 -
 223
223 -
 224
224 -
 225
225 -
226
-
227
-
228
-
229
-
230
-
231
-
232
-
233
-
234
-
235
-
236
-
237
-
238
-
239
-
240
-
241
-
242
-
243
-
244
-
245
-
246
-
247
-
248
-
249
-
250
-
251
-
252
-
253
-
254
-
255
-
256
-
257
-
258
-
259
-
260
-
261
-
262
-
263
-
264
-
265
-
266
-
267
-
268
-
269
-
270
-
271
-
272
-
273
-
274
-
275
-
276
-
277
-
278
-
279
-
280
-
281
-
282
-
283
-
284
 |
 |

Bank of America 2013 213
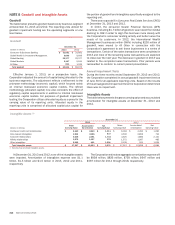
NOTE 9 Deposits
The Corporation had U.S. certificates of deposit and other U.S. time deposits of $100 thousand or more totaling $38.3 billion and
$41.9 billion at December 31, 2013 and 2012. Non-U.S. certificates of deposit and other non-U.S. time deposits of $100 thousand
or more totaled $26.2 billion and $29.1 billion at December 31, 2013 and 2012. The table below presents the contractual maturities
for time deposits of $100 thousand or more at December 31, 2013.
Time Deposits of $100 Thousand or More
(Dollars in millions)
Three Months
or Less
Over Three
Months to
Twelve Months Thereafter Total
U.S. certificates of deposit and other time deposits $ 16,246 $ 17,943 $ 4,155 $ 38,344
Non-U.S. certificates of deposit and other time deposits 23,726 1,983 481 26,190
The scheduled contractual maturities for total time deposits at December 31, 2013 are presented in the table below.
Contractual Maturities of Total Time Deposits
(Dollars in millions) U.S. Non-U.S. Total
Due in 2014 $ 71,895 $ 26,306 $ 98,201
Due in 2015 6,523 227 6,750
Due in 2016 1,719 315 2,034
Due in 2017 1,308 14 1,322
Due in 2018 649 1 650
Thereafter 2,274 4 2,278
Total time deposits $ 84,368 $ 26,867 $ 111,235
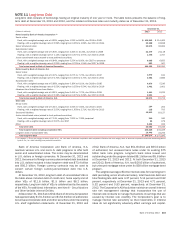
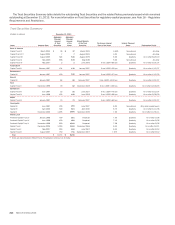
NOTE 10 Federal Funds Sold or Purchased, Securities Financing Agreements and Short-term
Borrowings
The table below presents federal funds sold or purchased, securities financing agreements which include securities borrowed or
purchased under agreements to resell and securities loaned or sold under agreements to repurchase, and short-term borrowings.
2013 2012 2011
(Dollars in millions) Amount Rate Amount Rate Amount Rate
Federal funds sold
At December 31 $——%
$ 600 0.54% $ 100 0.71%
Average during year 70.69 351 0.43 273 0.39
Maximum month-end balance during year 550 n/a 600 n/a 782 n/a
Securities borrowed or purchased under agreements to resell
At December 31 190,328 0.60 219,324 0.92 211,083 0.76
Average during year 224,324 0.55 235,691 0.64 244,796 0.88
Maximum month-end balance during year 249,791 n/a 252,985 n/a 270,201 n/a
Federal funds purchased
At December 31 186 —1,151 0.17 243 0.06
Average during year 192 0.06 384 0.11 1,658 0.08
Maximum month-end balance during year 1,272 n/a 1,211 n/a 4,133 n/a
Securities loaned or sold under agreements to repurchase
At December 31 197,920 0.92 292,108 1.11 214,621 1.08
Average during year 257,409 0.81 281,516 0.98 270,718 1.31
Maximum month-end balance during year 319,608 n/a 319,401 n/a 293,519 n/a
Short-term borrowings
At December 31 45,999 1.55 30,731 3.08 35,698 2.36
Average during year 43,816 1.89 36,500 2.22 51,893 2.00
Maximum month-end balance during year 48,387 n/a 40,129 n/a 62,621 n/a
n/a = not applicable
Bank of America, N.A. maintains a global program to offer up
to a maximum of $75 billion outstanding at any one time, of bank
notes with fixed or floating rates and maturities of at least seven
days from the date of issue. Short-term bank notes outstanding
under this program totaled $15.1 billion and $3.9 billion at
December 31, 2013 and 2012. These short-term bank notes,
along with Federal Home Loan Bank (FHLB) advances, U.S.
Treasury tax and loan notes, and term federal funds purchased,
are included in short-term borrowings on the Consolidated Balance
Sheet. For information regarding the long-term notes that have
been issued under the $75 billion bank note program, see Note
11 – Long-term Debt.