Bank of America 2013 Annual Report Download - page 132
Download and view the complete annual report
Please find page 132 of the 2013 Bank of America annual report below. You can navigate through the pages in the report by either clicking on the pages listed below, or by using the keyword search tool below to find specific information within the annual report.-
 1
1 -
2
-
3
-
4
-
5
-
6
-
7
-
8
-
9
-
10
-
11
-
12
-
13
-
14
-
15
-
16
-
17
-
18
-
19
-
20
-
21
-
22
-
23
-
24
-
25
-
26
-
27
-
28
-
29
-
30
-
31
-
32
-
33
-
34
-
35
-
36
-
37
-
38
-
39
-
40
-
41
-
42
-
43
-
44
-
45
-
46
-
47
-
48
-
49
-
50
-
51
-
52
-
53
-
54
-
55
-
56
-
57
-
58
-
59
-
60
-
61
-
62
-
63
-
64
-
65
-
66
-
67
-
68
-
69
-
70
-
71
-
72
-
73
-
74
-
75
-
76
-
77
-
78
-
79
-
80
-
81
-
82
-
83
-
84
-
85
-
86
-
87
-
88
-
89
-
90
-
91
-
92
-
93
-
94
-
95
-
96
-
97
-
98
-
99
-
100
-
101
-
102
-
103
-
104
-
105
-
106
-
107
-
108
-
109
-
110
-
111
-
112
-
113
-
114
-
115
-
116
-
117
-
118
-
119
-
120
-
121
-
 122
122 -
 123
123 -
 124
124 -
 125
125 -
 126
126 -
 127
127 -
 128
128 -
 129
129 -
 130
130 -
 131
131 -
 132
132 -
 133
133 -
 134
134 -
 135
135 -
 136
136 -
 137
137 -
 138
138 -
 139
139 -
 140
140 -
 141
141 -
 142
142 -
143
-
144
-
145
-
146
-
147
-
148
-
149
-
150
-
151
-
152
-
153
-
154
-
155
-
156
-
157
-
158
-
159
-
160
-
161
-
162
-
163
-
164
-
165
-
166
-
167
-
168
-
169
-
170
-
171
-
172
-
173
-
174
-
175
-
176
-
177
-
178
-
179
-
180
-
181
-
182
-
183
-
184
-
185
-
186
-
187
-
188
-
189
-
190
-
191
-
192
-
193
-
194
-
195
-
196
-
197
-
198
-
199
-
200
-
201
-
202
-
203
-
204
-
205
-
206
-
207
-
208
-
209
-
210
-
211
-
212
-
213
-
214
-
215
-
216
-
217
-
218
-
219
-
220
-
221
-
222
-
223
-
224
-
225
-
226
-
227
-
228
-
229
-
230
-
231
-
232
-
233
-
234
-
235
-
236
-
237
-
238
-
239
-
240
-
241
-
242
-
243
-
244
-
245
-
246
-
247
-
248
-
249
-
250
-
251
-
252
-
253
-
254
-
255
-
256
-
257
-
258
-
259
-
260
-
261
-
262
-
263
-
264
-
265
-
266
-
267
-
268
-
269
-
270
-
271
-
272
-
273
-
274
-
275
-
276
-
277
-
278
-
279
-
280
-
281
-
282
-
283
-
284
 |
 |

130 Bank of America 2013
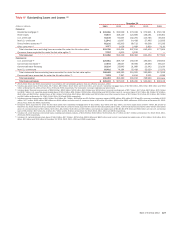
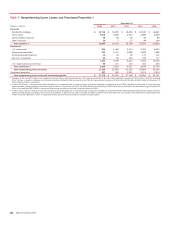
Table VII Allowance for Credit Losses
(Dollars in millions) 2013 2012 2011 2010 2009
Allowance for loan and lease losses, January 1 (1) $ 24,179 $ 33,783 $ 41,885 $ 47,988 $ 23,071
Loans and leases charged off
Residential mortgage (1,508)(3,276) (4,294) (3,843) (4,525)
Home equity (2,258)(4,573) (4,997) (7,072) (7,220)
U.S. credit card (4,004)(5,360) (8,114) (13,818) (6,753)
Non-U.S. credit card (508) (835) (1,691) (2,424) (1,332)
Direct/Indirect consumer (710) (1,258) (2,190) (4,303) (6,406)
Other consumer (273) (274) (252) (320) (491)
Total consumer charge-offs (9,261)(15,576) (21,538) (31,780) (26,727)
U.S. commercial (2) (774) (1,309) (1,690) (3,190) (5,237)
Commercial real estate (251) (719) (1,298) (2,185) (2,744)
Commercial lease financing (4) (32) (61) (96) (217)
Non-U.S. commercial (79) (36) (155) (139) (558)
Total commercial charge-offs (1,108)(2,096) (3,204) (5,610) (8,756)
Total loans and leases charged off (10,369) (17,672) (24,742) (37,390) (35,483)
Recoveries of loans and leases previously charged off
Residential mortgage 424 165 377 117 89
Home equity 455 331 517 279 155
U.S. credit card 628 728 838 791 206
Non-U.S. credit card 109 254 522 217 93
Direct/Indirect consumer 365 495 714 967 943
Other consumer 39 42 50 59 63
Total consumer recoveries 2,020 2,015 3,018 2,430 1,549
U.S. commercial (3) 287 368 500 391 161
Commercial real estate 102 335 351 168 42
Commercial lease financing 29 38 37 39 22
Non-U.S. commercial 34 8 3 28 21
Total commercial recoveries 452 749 891 626 246
Total recoveries of loans and leases previously charged off 2,472 2,764 3,909 3,056 1,795
Net charge-offs (7,897)(14,908) (20,833) (34,334) (33,688)
Write-offs of PCI loans (2,336)(2,820) — — —
Provision for loan and lease losses 3,574 8,310 13,629 28,195 48,366
Other (4) (92) (186) (898) 36 (549)
Allowance for loan and lease losses, December 31 17,428 24,179 33,783 41,885 37,200
Reserve for unfunded lending commitments, January 1 513 714 1,188 1,487 421
Provision for unfunded lending commitments (18) (141) (219) 240 204
Other (5) (11) (60) (255) (539) 862
Reserve for unfunded lending commitments, December 31 484 513 714 1,188 1,487
Allowance for credit losses, December 31 $ 17,912 $ 24,692 $ 34,497 $ 43,073 $ 38,687
(1) The 2010 balance includes $10.8 billion of allowance for loan and lease losses related to the adoption of consolidation guidance that was effective January 1, 2010.
(2) Includes U.S. small business commercial charge-offs of $457 million, $799 million, $1.1 billion, $2.0 billion and $3.0 billion in 2013, 2012, 2011, 2010 and 2009, respectively.
(3) Includes U.S. small business commercial recoveries of $98 million, $100 million, $106 million, $107 million and $65 million in 2013, 2012, 2011, 2010 and 2009, respectively.
(4) The 2013, 2012 and 2011 amounts primarily represent the net impact of portfolio sales, consolidations and deconsolidations, and foreign currency translation adjustments. In addition, the 2011
amount includes a $449 million reduction in the allowance for loan and lease losses related to Canadian consumer card loans that were transferred to LHFS. The 2009 amount includes a $750
million reduction in the allowance for loan and lease losses related to credit card loans of $8.5 billion which were exchanged for $7.8 billion in held-to-maturity debt securities that were issued by
the Corporation’s U.S. Credit Card Securitization Trust and retained by the Corporation.
(5) The 2013, 2012, 2011 and 2010 amounts primarily represent accretion of the Merrill Lynch purchase accounting adjustment and the impact of funding previously unfunded positions. The 2009
amount includes the remaining balance of the acquired Merrill Lynch reserve excluding those commitments accounted for under the fair value option, net of accretion, and the impact of funding
previously unfunded positions.