Bank of America 2013 Annual Report Download - page 214
Download and view the complete annual report
Please find page 214 of the 2013 Bank of America annual report below. You can navigate through the pages in the report by either clicking on the pages listed below, or by using the keyword search tool below to find specific information within the annual report.-
 1
1 -
2
-
3
-
4
-
5
-
6
-
7
-
8
-
9
-
10
-
11
-
12
-
13
-
14
-
15
-
16
-
17
-
18
-
19
-
20
-
21
-
22
-
23
-
24
-
25
-
26
-
27
-
28
-
29
-
30
-
31
-
32
-
33
-
34
-
35
-
36
-
37
-
38
-
39
-
40
-
41
-
42
-
43
-
44
-
45
-
46
-
47
-
48
-
49
-
50
-
51
-
52
-
53
-
54
-
55
-
56
-
57
-
58
-
59
-
60
-
61
-
62
-
63
-
64
-
65
-
66
-
67
-
68
-
69
-
70
-
71
-
72
-
73
-
74
-
75
-
76
-
77
-
78
-
79
-
80
-
81
-
82
-
83
-
84
-
85
-
86
-
87
-
88
-
89
-
90
-
91
-
92
-
93
-
94
-
95
-
96
-
97
-
98
-
99
-
100
-
101
-
102
-
103
-
104
-
105
-
106
-
107
-
108
-
109
-
110
-
111
-
112
-
113
-
114
-
115
-
116
-
117
-
118
-
119
-
120
-
121
-
122
-
123
-
124
-
125
-
126
-
127
-
128
-
129
-
130
-
131
-
132
-
133
-
134
-
135
-
136
-
137
-
138
-
139
-
140
-
141
-
142
-
143
-
144
-
145
-
146
-
147
-
148
-
149
-
150
-
151
-
152
-
153
-
154
-
155
-
156
-
157
-
158
-
159
-
160
-
161
-
162
-
163
-
164
-
165
-
166
-
167
-
168
-
169
-
170
-
171
-
172
-
173
-
174
-
175
-
176
-
177
-
178
-
179
-
180
-
181
-
182
-
183
-
184
-
185
-
186
-
187
-
188
-
189
-
190
-
191
-
192
-
193
-
194
-
195
-
196
-
197
-
198
-
199
-
200
-
201
-
202
-
203
-
 204
204 -
 205
205 -
 206
206 -
 207
207 -
 208
208 -
 209
209 -
 210
210 -
 211
211 -
 212
212 -
 213
213 -
 214
214 -
 215
215 -
 216
216 -
 217
217 -
 218
218 -
 219
219 -
 220
220 -
 221
221 -
 222
222 -
 223
223 -
 224
224 -
225
-
226
-
227
-
228
-
229
-
230
-
231
-
232
-
233
-
234
-
235
-
236
-
237
-
238
-
239
-
240
-
241
-
242
-
243
-
244
-
245
-
246
-
247
-
248
-
249
-
250
-
251
-
252
-
253
-
254
-
255
-
256
-
257
-
258
-
259
-
260
-
261
-
262
-
263
-
264
-
265
-
266
-
267
-
268
-
269
-
270
-
271
-
272
-
273
-
274
-
275
-
276
-
277
-
278
-
279
-
280
-
281
-
282
-
283
-
284
 |
 |

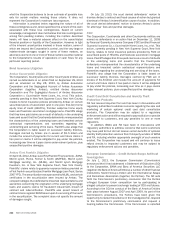
212 Bank of America 2013
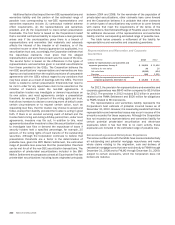
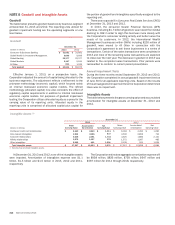
NOTE 8 Goodwill and Intangible Assets
Goodwill
The table below presents goodwill balances by business segment
at December 31, 2013 and 2012. The reporting units utilized for
goodwill impairment testing are the operating segments or one
level below.
Goodwill
December 31
(Dollars in millions) 2013 2012
Consumer & Business Banking $ 31,681 $ 31,681
Global Wealth & Investment Management 9,698 9,698
Global Banking 22,377 22,377
Global Markets 5,197 5,181
All Other 891 1,039
Total goodwill $ 69,844 $ 69,976
Effective January 1, 2013, on a prospective basis, the
Corporation adjusted the amount of capital being allocated to the
business segments. The adjustment reflects a refinement to the
prior-year methodology (economic capital), which focused solely
on internal risk-based economic capital models. The refined
methodology (allocated capital) now also considers the effect of
regulatory capital requirements in addition to internal risk-based
economic capital models. For purposes of goodwill impairment
testing, the Corporation utilizes allocated equity as a proxy for the
carrying value of its reporting units. Allocated equity in the
reporting units is comprised of allocated capital plus capital for
the portion of goodwill and intangibles specifically assigned to the
reporting unit.
There was no goodwill in Consumer Real Estate Services (CRES)
at December 31, 2013 and 2012.
In 2013, the consumer Dealer Financial Services (DFS)
business, including $1.7 billion of goodwill, was moved from Global
Banking to CBB in order to align this business more closely with
the Corporation’s consumer lending activity and better serve the
needs of its customers. In 2012, the International Wealth
Management businesses within GWIM, including $230 million of
goodwill, were moved to All Other in connection with the
Corporation’s agreement to sell these businesses in a series of
transactions. Certain of the sales transactions were completed in
2013 and most of the remaining sales transactions are expected
to close over the next year. The decrease in goodwill in 2013 was
related to the completed sales transactions. Prior periods were
reclassified to conform to current period presentation.
Annual Impairment Tests
During the three months ended September 30, 2013 and 2012,
the Corporation completed its annual goodwill impairment test as
of June 30 for all applicable reporting units. Based on the results
of the annual goodwill impairment test, the Corporation determined
there was no impairment.
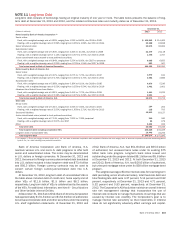
Intangible Assets
The table below presents the gross carrying value and accumulated
amortization for intangible assets at December 31, 2013 and
2012.
Intangible Assets (1)
December 31
2013 2012
(Dollars in millions)
Gross
Carrying Value
Accumulated
Amortization
Net
Carrying Value
Gross
Carrying Value
Accumulated
Amortization
Net
Carrying Value
Purchased credit card relationships $ 6,160 $ 4,849 $ 1,311 $ 6,184 $ 4,494 $ 1,690
Core deposit intangibles 3,592 3,055 537 3,592 2,858 734
Customer relationships 4,025 2,281 1,744 4,025 1,884 2,141
Affinity relationships 1,575 1,197 378 1,572 1,087 485
Other intangibles 2,045 441 1,604 2,139 505 1,634
Total intangible assets $ 17,397 $ 11,823 $ 5,574 $ 17,512 $ 10,828 $ 6,684
(1) Excludes fully amortized intangible assets.
At December 31, 2013 and 2012, none of the intangible assets
were impaired. Amortization of intangibles expense was $1.1
billion, $1.3 billion and $1.5 billion in 2013, 2012 and 2011,
respectively.
The Corporation estimates aggregate amortization expense will
be $938 million, $836 million, $739 million, $647 million and
$567 million for 2014 through 2018, respectively.