Bank of America 2013 Annual Report Download - page 253
Download and view the complete annual report
Please find page 253 of the 2013 Bank of America annual report below. You can navigate through the pages in the report by either clicking on the pages listed below, or by using the keyword search tool below to find specific information within the annual report.-
 1
1 -
2
-
3
-
4
-
5
-
6
-
7
-
8
-
9
-
10
-
11
-
12
-
13
-
14
-
15
-
16
-
17
-
18
-
19
-
20
-
21
-
22
-
23
-
24
-
25
-
26
-
27
-
28
-
29
-
30
-
31
-
32
-
33
-
34
-
35
-
36
-
37
-
38
-
39
-
40
-
41
-
42
-
43
-
44
-
45
-
46
-
47
-
48
-
49
-
50
-
51
-
52
-
53
-
54
-
55
-
56
-
57
-
58
-
59
-
60
-
61
-
62
-
63
-
64
-
65
-
66
-
67
-
68
-
69
-
70
-
71
-
72
-
73
-
74
-
75
-
76
-
77
-
78
-
79
-
80
-
81
-
82
-
83
-
84
-
85
-
86
-
87
-
88
-
89
-
90
-
91
-
92
-
93
-
94
-
95
-
96
-
97
-
98
-
99
-
100
-
101
-
102
-
103
-
104
-
105
-
106
-
107
-
108
-
109
-
110
-
111
-
112
-
113
-
114
-
115
-
116
-
117
-
118
-
119
-
120
-
121
-
122
-
123
-
124
-
125
-
126
-
127
-
128
-
129
-
130
-
131
-
132
-
133
-
134
-
135
-
136
-
137
-
138
-
139
-
140
-
141
-
142
-
143
-
144
-
145
-
146
-
147
-
148
-
149
-
150
-
151
-
152
-
153
-
154
-
155
-
156
-
157
-
158
-
159
-
160
-
161
-
162
-
163
-
164
-
165
-
166
-
167
-
168
-
169
-
170
-
171
-
172
-
173
-
174
-
175
-
176
-
177
-
178
-
179
-
180
-
181
-
182
-
183
-
184
-
185
-
186
-
187
-
188
-
189
-
190
-
191
-
192
-
193
-
194
-
195
-
196
-
197
-
198
-
199
-
200
-
201
-
202
-
203
-
204
-
205
-
206
-
207
-
208
-
209
-
210
-
211
-
212
-
213
-
214
-
215
-
216
-
217
-
218
-
219
-
220
-
221
-
222
-
223
-
224
-
225
-
226
-
227
-
228
-
229
-
230
-
231
-
232
-
233
-
234
-
235
-
236
-
237
-
238
-
239
-
240
-
241
-
242
-
 243
243 -
 244
244 -
 245
245 -
 246
246 -
 247
247 -
 248
248 -
 249
249 -
 250
250 -
 251
251 -
 252
252 -
 253
253 -
 254
254 -
 255
255 -
 256
256 -
 257
257 -
 258
258 -
 259
259 -
 260
260 -
 261
261 -
 262
262 -
 263
263 -
264
-
265
-
266
-
267
-
268
-
269
-
270
-
271
-
272
-
273
-
274
-
275
-
276
-
277
-
278
-
279
-
280
-
281
-
282
-
283
-
284
 |
 |

Bank of America 2013 251
Considering all examinations, it is reasonably possible that the
UTB balance may decrease by as much as $2.1 billion during the
next 12 months, since resolved items will be removed from the
balance whether their resolution results in payment or recognition.
If such decrease were to occur, it likely would primarily result from
outcomes consistent with management expectations.
During 2013 and 2012, the Corporation recognized $127
million and $99 million of expense and, in 2011, a benefit of $168
million for interest and penalties, net-of-tax, in income tax expense
(benefit). At December 31, 2013 and 2012, the Corporation’s
accrual for interest and penalties that related to income taxes, net
of taxes and remittances, was $888 million and $775 million.
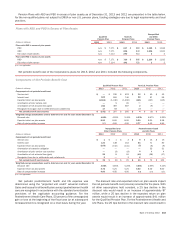
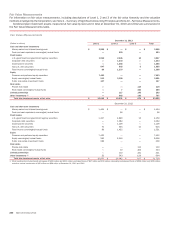
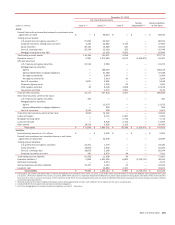
Significant components of the Corporation’s net deferred tax
assets and liabilities at December 31, 2013 and 2012 are
presented in the table below.
Deferred Tax Assets and Liabilities
December 31
(Dollars in millions) 2013 2012
Deferred tax assets
Net operating loss carryforwards $ 10,967 $ 13,863
Tax credit carryforwards 9,689 9,529
Accrued expenses 6,749 8,099
Allowance for credit losses 6,100 8,463
Security, loan and debt valuations 4,264 2,712
Employee compensation and retirement benefits 2,729 4,612
State income taxes 2,643 2,766
Available-for-sale securities 1,918 —
Other 722 725
Gross deferred tax assets 45,781 50,769
Valuation allowance (1,940) (2,211)
Total deferred tax assets, net of valuation
allowance 43,841 48,558
Deferred tax liabilities
Equipment lease financing 3,106 3,371
Long-term borrowings 3,033 3,215
Mortgage servicing rights 1,547 1,986
Intangibles 1,529 1,708
Fee income 798 901
Available-for-sale securities —2,877
Other 1,472 1,462
Gross deferred tax liabilities 11,485 15,520
Net deferred tax assets $ 32,356 $ 33,038
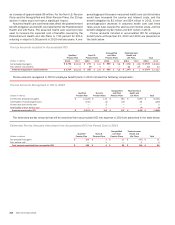
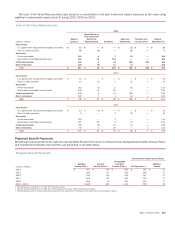
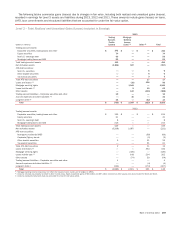
The table below summarizes the deferred tax assets and
related valuation allowances recognized for the net operating loss
(NOL) and tax credit carryforwards at December 31, 2013.
Net Operating Loss and Tax Credit Carryforwards
(Dollars in millions)
Deferred
Tax Asset
Valuation
Allowance
Net
Deferred
Tax Asset
First Year
Expiring
Net operating losses – U.S. $ 3,061 $ — $ 3,061 After 2027
Net operating losses – U.K. 7,417 — 7,417 None (1)
Net operating losses –
other non-U.S. 489 (366) 123 Various
Net operating losses – U.S.
states (2) 2,039 (1,025) 1,014 Various
General business credits 4,034 — 4,034 After 2027
Foreign tax credits 5,655 (271) 5,384 After 2017
(1) The U.K. net operating losses may be carried forward indefinitely.
(2) The net operating losses and related valuation allowances for U.S. states before considering
the benefit of federal deductions were $3.1 billion and $1.6 billion.
Management concluded that no valuation allowance was
necessary to reduce the U.K. NOL carryforwards and U.S. NOL and
general business credit carryforwards since estimated future
taxable income will be sufficient to utilize these assets prior to
their expiration. The majority of the Corporation’s U.K. net deferred
tax assets, which consist primarily of NOLs, are expected to be
realized by certain subsidiaries over an extended number of years.
Management’s conclusion is supported by recent financial results
and forecasts, the reorganization of certain business activities and
the indefinite period to carry forward NOLs. However, significant
changes to those estimates, such as changes that would be
caused by a substantial and prolonged worsening of the condition
of Europe’s capital markets, could lead management to reassess
its U.K. valuation allowance conclusions.
At December 31, 2013, U.S. federal income taxes had not been
provided on $17.0 billion of undistributed earnings of non-U.S.
subsidiaries that management has determined have been
reinvested for an indefinite period of time. If the Corporation were
to record a deferred tax liability associated with these
undistributed earnings, the amount would be approximately $4.3
billion at December 31, 2013.