Bank of America 2013 Annual Report Download - page 48
Download and view the complete annual report
Please find page 48 of the 2013 Bank of America annual report below. You can navigate through the pages in the report by either clicking on the pages listed below, or by using the keyword search tool below to find specific information within the annual report.-
 1
1 -
2
-
3
-
4
-
5
-
6
-
7
-
8
-
9
-
10
-
11
-
12
-
13
-
14
-
15
-
16
-
17
-
18
-
19
-
20
-
21
-
22
-
23
-
24
-
25
-
26
-
27
-
28
-
29
-
30
-
31
-
32
-
33
-
34
-
35
-
36
-
37
-
 38
38 -
 39
39 -
 40
40 -
 41
41 -
 42
42 -
 43
43 -
 44
44 -
 45
45 -
 46
46 -
 47
47 -
 48
48 -
 49
49 -
 50
50 -
 51
51 -
 52
52 -
 53
53 -
 54
54 -
 55
55 -
 56
56 -
 57
57 -
 58
58 -
59
-
60
-
61
-
62
-
63
-
64
-
65
-
66
-
67
-
68
-
69
-
70
-
71
-
72
-
73
-
74
-
75
-
76
-
77
-
78
-
79
-
80
-
81
-
82
-
83
-
84
-
85
-
86
-
87
-
88
-
89
-
90
-
91
-
92
-
93
-
94
-
95
-
96
-
97
-
98
-
99
-
100
-
101
-
102
-
103
-
104
-
105
-
106
-
107
-
108
-
109
-
110
-
111
-
112
-
113
-
114
-
115
-
116
-
117
-
118
-
119
-
120
-
121
-
122
-
123
-
124
-
125
-
126
-
127
-
128
-
129
-
130
-
131
-
132
-
133
-
134
-
135
-
136
-
137
-
138
-
139
-
140
-
141
-
142
-
143
-
144
-
145
-
146
-
147
-
148
-
149
-
150
-
151
-
152
-
153
-
154
-
155
-
156
-
157
-
158
-
159
-
160
-
161
-
162
-
163
-
164
-
165
-
166
-
167
-
168
-
169
-
170
-
171
-
172
-
173
-
174
-
175
-
176
-
177
-
178
-
179
-
180
-
181
-
182
-
183
-
184
-
185
-
186
-
187
-
188
-
189
-
190
-
191
-
192
-
193
-
194
-
195
-
196
-
197
-
198
-
199
-
200
-
201
-
202
-
203
-
204
-
205
-
206
-
207
-
208
-
209
-
210
-
211
-
212
-
213
-
214
-
215
-
216
-
217
-
218
-
219
-
220
-
221
-
222
-
223
-
224
-
225
-
226
-
227
-
228
-
229
-
230
-
231
-
232
-
233
-
234
-
235
-
236
-
237
-
238
-
239
-
240
-
241
-
242
-
243
-
244
-
245
-
246
-
247
-
248
-
249
-
250
-
251
-
252
-
253
-
254
-
255
-
256
-
257
-
258
-
259
-
260
-
261
-
262
-
263
-
264
-
265
-
266
-
267
-
268
-
269
-
270
-
271
-
272
-
273
-
274
-
275
-
276
-
277
-
278
-
279
-
280
-
281
-
282
-
283
-
284
 |
 |

46 Bank of America 2013
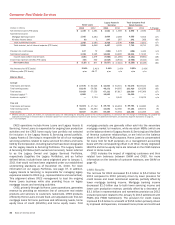
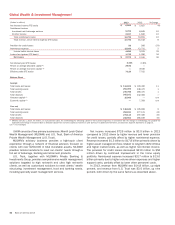
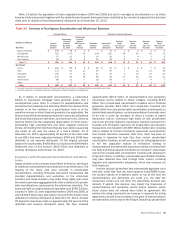
All Other
(Dollars in millions) 2013 2012 % Change
Net interest income (FTE basis) $966 $ 1,140 (15)%
Noninterest income:
Card income 328 360 (9)
Equity investment income 2,610 1,135 130
Gains on sales of debt securities 1,230 1,510 (19)
All other loss (3,245)(4,927) (34)
Total noninterest income (loss) 923 (1,922) n/m
Total revenue, net of interest expense (FTE basis) 1,889 (782) n/m
Provision for credit losses (666) 2,621 n/m
Noninterest expense 4,241 6,273 (32)
Loss before income taxes (1,686)(9,676) (83)
Income tax benefit (FTE basis) (2,173)(5,939) (63)
Net income (loss) $ 487 $ (3,737) n/m
Balance Sheet
Average
Loans and leases:
Residential mortgage $ 208,535 $223,795 (7)
Non-U.S. credit card 10,861 13,549 (20)
Other 16,058 21,897 (27)
Total loans and leases 235,454 259,241 (9)
Total assets (1) 215,183 315,735 (32)
Total deposits 34,617 43,087 (20)
Year end
Loans and leases:
Residential mortgage $ 197,061 $211,476 (7)
Non-U.S. credit card 11,541 11,697 (1)
Other 12,092 18,808 (36)
Total loans and leases 220,694 241,981 (9)
Total assets (1) 166,881 262,800 (36)
Total deposits 27,702 36,061 (23)
(1) For presentation purposes, in segments where the total of liabilities and equity exceeds assets, which are generally deposit-taking segments, we allocate assets from All Other to those segments
to match liabilities (i.e., deposits) and allocated shareholders’ equity. Such allocated assets were $539.5 billion and $504.2 billion for 2013 and 2012, and $570.3 billion and $537.6 billion at
December 31, 2013 and 2012.
n/m = not meaningful
All Other consists of ALM activities, equity investments, the
international consumer card business, liquidating businesses,
residual expense allocations and other. ALM activities encompass
the whole-loan residential mortgage portfolio and investment
securities, interest rate and foreign currency risk management
activities including the residual net interest income allocation,
gains/losses on structured liabilities, the impact of certain
allocation methodologies and accounting hedge ineffectiveness.
The results of certain ALM activities are allocated to our business
segments. For more information on our ALM activities, see Interest
Rate Risk Management for Nontrading Activities on page 109.
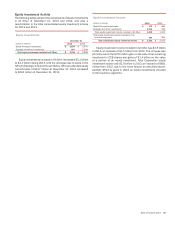
Equity investments include Global Principal Investments (GPI)
which is comprised of a portfolio of equity, real estate and other
alternative investments. These investments are made either
directly in a company or held through a fund with related income
recorded in equity investment income. Equity investments included
our remaining investment in CCB which was sold during 2013, and
certain other investments. Additionally, certain residential
mortgage loans that are managed by Legacy Assets & Servicing
are held in All Other.
Net income for All Other increased $4.2 billion to $487 million
in 2013 primarily due to negative fair value adjustments on
structured liabilities of $649 million related to the improvement
in our credit spreads during 2013 compared to a negative $5.1
billion in 2012, a $3.3 billion reduction in the provision for credit
losses, a decrease in noninterest expense of $2.0 billion and an
increase in equity investment income of $1.5 billion. Partially
offsetting the increases were $1.6 billion in gains related to debt
repurchases and exchanges of trust preferred securities in 2012
and a decrease of $280 million in gains on sales of debt securities.
The provision for credit losses improved $3.3 billion to a benefit
of $666 million in 2013 primarily driven by continued improvement
in portfolio trends including increased home prices in the
residential mortgage portfolio.
Noninterest expense decreased $2.0 billion to $4.2 billion
primarily due to lower litigation expense. The income tax benefit
was $2.2 billion in 2013 compared to a benefit of $5.9 billion in
2012. The decrease was driven by the decline in the pre-tax loss
in All Other and lower tax benefits as 2012 included a $1.7 billion
tax benefit attributable to the excess of foreign tax credits
recognized in the U.S. upon repatriation of the earnings of certain
subsidiaries over the related U.S. tax liability.