Bank of America 2013 Annual Report Download - page 195
Download and view the complete annual report
Please find page 195 of the 2013 Bank of America annual report below. You can navigate through the pages in the report by either clicking on the pages listed below, or by using the keyword search tool below to find specific information within the annual report.-
 1
1 -
2
-
3
-
4
-
5
-
6
-
7
-
8
-
9
-
10
-
11
-
12
-
13
-
14
-
15
-
16
-
17
-
18
-
19
-
20
-
21
-
22
-
23
-
24
-
25
-
26
-
27
-
28
-
29
-
30
-
31
-
32
-
33
-
34
-
35
-
36
-
37
-
38
-
39
-
40
-
41
-
42
-
43
-
44
-
45
-
46
-
47
-
48
-
49
-
50
-
51
-
52
-
53
-
54
-
55
-
56
-
57
-
58
-
59
-
60
-
61
-
62
-
63
-
64
-
65
-
66
-
67
-
68
-
69
-
70
-
71
-
72
-
73
-
74
-
75
-
76
-
77
-
78
-
79
-
80
-
81
-
82
-
83
-
84
-
85
-
86
-
87
-
88
-
89
-
90
-
91
-
92
-
93
-
94
-
95
-
96
-
97
-
98
-
99
-
100
-
101
-
102
-
103
-
104
-
105
-
106
-
107
-
108
-
109
-
110
-
111
-
112
-
113
-
114
-
115
-
116
-
117
-
118
-
119
-
120
-
121
-
122
-
123
-
124
-
125
-
126
-
127
-
128
-
129
-
130
-
131
-
132
-
133
-
134
-
135
-
136
-
137
-
138
-
139
-
140
-
141
-
142
-
143
-
144
-
145
-
146
-
147
-
148
-
149
-
150
-
151
-
152
-
153
-
154
-
155
-
156
-
157
-
158
-
159
-
160
-
161
-
162
-
163
-
164
-
165
-
166
-
167
-
168
-
169
-
170
-
171
-
172
-
173
-
174
-
175
-
176
-
177
-
178
-
179
-
180
-
181
-
182
-
183
-
184
-
 185
185 -
 186
186 -
 187
187 -
 188
188 -
 189
189 -
 190
190 -
 191
191 -
 192
192 -
 193
193 -
 194
194 -
 195
195 -
 196
196 -
 197
197 -
 198
198 -
 199
199 -
 200
200 -
 201
201 -
 202
202 -
 203
203 -
 204
204 -
 205
205 -
206
-
207
-
208
-
209
-
210
-
211
-
212
-
213
-
214
-
215
-
216
-
217
-
218
-
219
-
220
-
221
-
222
-
223
-
224
-
225
-
226
-
227
-
228
-
229
-
230
-
231
-
232
-
233
-
234
-
235
-
236
-
237
-
238
-
239
-
240
-
241
-
242
-
243
-
244
-
245
-
246
-
247
-
248
-
249
-
250
-
251
-
252
-
253
-
254
-
255
-
256
-
257
-
258
-
259
-
260
-
261
-
262
-
263
-
264
-
265
-
266
-
267
-
268
-
269
-
270
-
271
-
272
-
273
-
274
-
275
-
276
-
277
-
278
-
279
-
280
-
281
-
282
-
283
-
284
 |
 |

Bank of America 2013 193
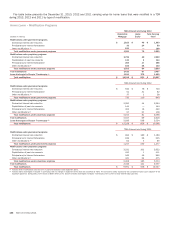
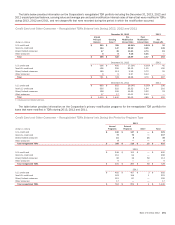
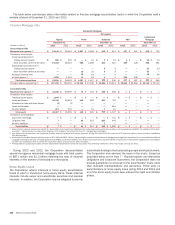
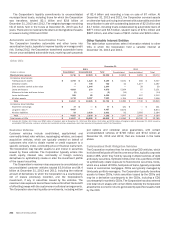
The table below provides information for impaired loans in the Corporation’s Commercial loan portfolio segment at December 31,
2013 and 2012, and for 2013, 2012 and 2011. Certain impaired commercial loans do not have a related allowance as the valuation
of these impaired loans exceeded the carrying value, which is net of previously recorded charge-offs.
Impaired Loans – Commercial
December 31, 2013 December 31, 2012
(Dollars in millions)
Unpaid
Principal
Balance
Carrying
Value
Related
Allowance
Unpaid
Principal
Balance
Carrying
Value
Related
Allowance
With no recorded allowance
U.S. commercial $ 609 $ 577 $ — $ 571 $ 476 $ —
Commercial real estate 254 228 — 370 316 —
Non-U.S. commercial 10 10 — 155 36 —
With an allowance recorded
U.S. commercial 1,581 1,262 164 2,431 1,771 159
Commercial real estate 1,066 731 61 2,920 1,848 201
Non-U.S. commercial 254 64 16 365 117 18
U.S. small business commercial (1) 186 176 36 361 317 97
Total
U.S. commercial $ 2,190 $ 1,839 $ 164 $ 3,002 $ 2,247 $ 159
Commercial real estate 1,320 959 61 3,290 2,164 201
Non-U.S. commercial 264 74 16 520 153 18
U.S. small business commercial (1) 186 176 36 361 317 97
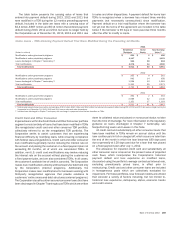
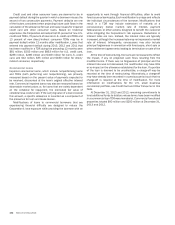
2013 2012 2011
Average
Carrying
Value
Interest
Income
Recognized (2)
Average
Carrying
Value
Interest
Income
Recognized (2)
Average
Carrying
Value
Interest
Income
Recognized (2)
With no recorded allowance
U.S. commercial $ 442 $ 6 $ 588 $ 9 $ 774 $ 7
Commercial real estate 269 3 1,119 3 1,994 7
Non-U.S. commercial 28 — 104 — 101 —
With an allowance recorded
U.S. commercial 1,553 47 2,104 55 2,422 13
Commercial real estate 1,148 28 2,126 29 3,309 19
Non-U.S. commercial 109 5 77 4 76 3
U.S. small business commercial (1) 236 6 409 13 666 23
Total
U.S. commercial $ 1,995 $ 53 $ 2,692 $ 64 $ 3,196 $ 20
Commercial real estate 1,417 31 3,245 32 5,303 26
Non-U.S. commercial 137 5 181 4 177 3
U.S. small business commercial (1) 236 6 409 13 666 23
(1) Includes U.S. small business commercial renegotiated TDR loans and related allowance.
(2) Interest income recognized includes interest accrued and collected on the outstanding balances of accruing impaired loans as well as interest cash collections on nonaccruing impaired loans for
which the principal is considered collectible.