Bank of America 2013 Annual Report Download - page 85
Download and view the complete annual report
Please find page 85 of the 2013 Bank of America annual report below. You can navigate through the pages in the report by either clicking on the pages listed below, or by using the keyword search tool below to find specific information within the annual report.-
 1
1 -
2
-
3
-
4
-
5
-
6
-
7
-
8
-
9
-
10
-
11
-
12
-
13
-
14
-
15
-
16
-
17
-
18
-
19
-
20
-
21
-
22
-
23
-
24
-
25
-
26
-
27
-
28
-
29
-
30
-
31
-
32
-
33
-
34
-
35
-
36
-
37
-
38
-
39
-
40
-
41
-
42
-
43
-
44
-
45
-
46
-
47
-
48
-
49
-
50
-
51
-
52
-
53
-
54
-
55
-
56
-
57
-
58
-
59
-
60
-
61
-
62
-
63
-
64
-
65
-
66
-
67
-
68
-
69
-
70
-
71
-
72
-
73
-
74
-
 75
75 -
 76
76 -
 77
77 -
 78
78 -
 79
79 -
 80
80 -
 81
81 -
 82
82 -
 83
83 -
 84
84 -
 85
85 -
 86
86 -
 87
87 -
 88
88 -
 89
89 -
 90
90 -
 91
91 -
 92
92 -
 93
93 -
 94
94 -
 95
95 -
96
-
97
-
98
-
99
-
100
-
101
-
102
-
103
-
104
-
105
-
106
-
107
-
108
-
109
-
110
-
111
-
112
-
113
-
114
-
115
-
116
-
117
-
118
-
119
-
120
-
121
-
122
-
123
-
124
-
125
-
126
-
127
-
128
-
129
-
130
-
131
-
132
-
133
-
134
-
135
-
136
-
137
-
138
-
139
-
140
-
141
-
142
-
143
-
144
-
145
-
146
-
147
-
148
-
149
-
150
-
151
-
152
-
153
-
154
-
155
-
156
-
157
-
158
-
159
-
160
-
161
-
162
-
163
-
164
-
165
-
166
-
167
-
168
-
169
-
170
-
171
-
172
-
173
-
174
-
175
-
176
-
177
-
178
-
179
-
180
-
181
-
182
-
183
-
184
-
185
-
186
-
187
-
188
-
189
-
190
-
191
-
192
-
193
-
194
-
195
-
196
-
197
-
198
-
199
-
200
-
201
-
202
-
203
-
204
-
205
-
206
-
207
-
208
-
209
-
210
-
211
-
212
-
213
-
214
-
215
-
216
-
217
-
218
-
219
-
220
-
221
-
222
-
223
-
224
-
225
-
226
-
227
-
228
-
229
-
230
-
231
-
232
-
233
-
234
-
235
-
236
-
237
-
238
-
239
-
240
-
241
-
242
-
243
-
244
-
245
-
246
-
247
-
248
-
249
-
250
-
251
-
252
-
253
-
254
-
255
-
256
-
257
-
258
-
259
-
260
-
261
-
262
-
263
-
264
-
265
-
266
-
267
-
268
-
269
-
270
-
271
-
272
-
273
-
274
-
275
-
276
-
277
-
278
-
279
-
280
-
281
-
282
-
283
-
284
 |
 |

Bank of America 2013 83
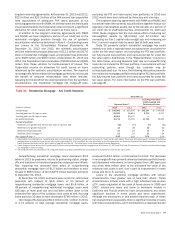
At December 31, 2013, the unpaid principal balance of pay
option loans was $4.5 billion, with a carrying value of $4.4 billion,
including $4.0 billion of loans that were credit-impaired upon
acquisition and, accordingly, the reserve is based on a life-of-loan
loss estimate. The total unpaid principal balance of pay option
loans with accumulated negative amortization was $2.2 billion
including $137 million of negative amortization. For those
borrowers who are making payments in accordance with their
contractual terms, five percent and 10 percent at December 31,
2013 and 2012 elected to make only the minimum payment on
pay option ARMs. We believe the majority of borrowers are now
making scheduled payments primarily because the low rate
environment has caused the fully indexed rates to be affordable
to more borrowers. We continue to evaluate our exposure to
payment resets on the acquired negative-amortizing loans
including the PCI pay option loan portfolio and have taken into
consideration in the evaluation several assumptions including
prepayment and default rates. Of the loans in the pay option
portfolio at December 31, 2013 that have not already experienced
a payment reset, less than one percent are expected to reset
before 2016, 26 percent are expected to reset in 2016 and
approximately 10 percent are expected to reset thereafter. In
addition, 10 percent are expected to prepay and approximately 53
percent are expected to default prior to being reset, most of which
were severely delinquent as of December 31, 2013.
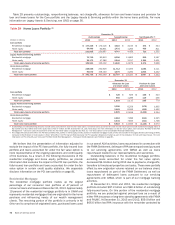
Purchased Credit-impaired Home Equity Loan Portfolio
The PCI home equity portfolio represented 26 percent of the total
PCI loan portfolio at December 31, 2013. Those loans with a
refreshed FICO score below 620 represented 16 percent of the
PCI home equity portfolio at December 31, 2013. Loans with a
refreshed CLTV greater than 90 percent, after consideration of
purchase accounting adjustments and the related valuation
allowance, represented 69 percent of the PCI home equity portfolio
and 71 percent based on the unpaid principal balance at
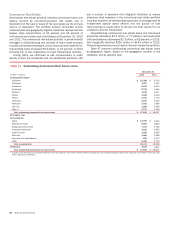
December 31, 2013. Table 36 presents outstandings net of
purchase accounting adjustments and before the related valuation
allowance, by certain state concentrations.
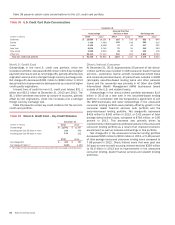
Table 36 Outstanding Purchased Credit-impaired Loan
Portfolio – Home Equity State Concentrations
December 31
(Dollars in millions) 2013 2012
California $ 1,921 $ 2,629
Florida (1) 356 524
Virginia 310 383
Arizona 214 297
Colorado 199 264
Other U.S./Non-U.S. 3,593 4,570
Total $ 6,593 $ 8,667
(1) In this state, foreclosure requires a court order following a legal proceeding (judicial state).
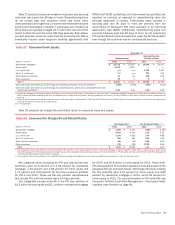
U.S. Credit Card
At December 31, 2013, 96 percent of the U.S. credit card portfolio
was managed in CBB with the remainder managed in GWIM.
Outstandings in the U.S. credit card portfolio decreased $2.5
billion in 2013 primarily due to higher payment volumes as well
as net charge-offs and the transfer of loans to LHFS, partially offset
by new originations. Net charge-offs decreased $1.3 billion to $3.4
billion in 2013 due to improvements in delinquencies and
bankruptcies as a result of an improved economic environment,
account management on higher risk accounts and the impact of
higher credit quality originations. U.S. credit card loans 30 days
or more past due and still accruing interest decreased $675 million
while loans 90 days or more past due and still accruing interest
declined $384 million in 2013 as a result of the factors mentioned
above that contributed to lower net charge-offs.
Table 37 presents certain key credit statistics for the U.S. credit
card portfolio.
Table 37 U.S. Credit Card – Key Credit Statistics
December 31
(Dollars in millions) 2013 2012
Outstandings $ 92,338 $ 94,835
Accruing past due 30 days or more 2,073 2,748
Accruing past due 90 days or more 1,053 1,437
2013 2012
Net charge-offs $ 3,376 $ 4,632
Net charge-off ratios (1) 3.74% 4.88%
(1) Net charge-off ratios are calculated as net charge-offs divided by average outstanding loans.
Unused lines of credit for U.S. credit card totaled $315.1 billion
and $335.5 billion at December 31, 2013 and 2012. The $20.4
billion decrease was driven by closure of inactive accounts,
partially offset by new originations and credit line increases.