Bank of America 2013 Annual Report Download - page 95
Download and view the complete annual report
Please find page 95 of the 2013 Bank of America annual report below. You can navigate through the pages in the report by either clicking on the pages listed below, or by using the keyword search tool below to find specific information within the annual report.-
 1
1 -
2
-
3
-
4
-
5
-
6
-
7
-
8
-
9
-
10
-
11
-
12
-
13
-
14
-
15
-
16
-
17
-
18
-
19
-
20
-
21
-
22
-
23
-
24
-
25
-
26
-
27
-
28
-
29
-
30
-
31
-
32
-
33
-
34
-
35
-
36
-
37
-
38
-
39
-
40
-
41
-
42
-
43
-
44
-
45
-
46
-
47
-
48
-
49
-
50
-
51
-
52
-
53
-
54
-
55
-
56
-
57
-
58
-
59
-
60
-
61
-
62
-
63
-
64
-
65
-
66
-
67
-
68
-
69
-
70
-
71
-
72
-
73
-
74
-
75
-
76
-
77
-
78
-
79
-
80
-
81
-
82
-
83
-
84
-
 85
85 -
 86
86 -
 87
87 -
 88
88 -
 89
89 -
 90
90 -
 91
91 -
 92
92 -
 93
93 -
 94
94 -
 95
95 -
 96
96 -
 97
97 -
 98
98 -
 99
99 -
 100
100 -
 101
101 -
 102
102 -
 103
103 -
 104
104 -
 105
105 -
106
-
107
-
108
-
109
-
110
-
111
-
112
-
113
-
114
-
115
-
116
-
117
-
118
-
119
-
120
-
121
-
122
-
123
-
124
-
125
-
126
-
127
-
128
-
129
-
130
-
131
-
132
-
133
-
134
-
135
-
136
-
137
-
138
-
139
-
140
-
141
-
142
-
143
-
144
-
145
-
146
-
147
-
148
-
149
-
150
-
151
-
152
-
153
-
154
-
155
-
156
-
157
-
158
-
159
-
160
-
161
-
162
-
163
-
164
-
165
-
166
-
167
-
168
-
169
-
170
-
171
-
172
-
173
-
174
-
175
-
176
-
177
-
178
-
179
-
180
-
181
-
182
-
183
-
184
-
185
-
186
-
187
-
188
-
189
-
190
-
191
-
192
-
193
-
194
-
195
-
196
-
197
-
198
-
199
-
200
-
201
-
202
-
203
-
204
-
205
-
206
-
207
-
208
-
209
-
210
-
211
-
212
-
213
-
214
-
215
-
216
-
217
-
218
-
219
-
220
-
221
-
222
-
223
-
224
-
225
-
226
-
227
-
228
-
229
-
230
-
231
-
232
-
233
-
234
-
235
-
236
-
237
-
238
-
239
-
240
-
241
-
242
-
243
-
244
-
245
-
246
-
247
-
248
-
249
-
250
-
251
-
252
-
253
-
254
-
255
-
256
-
257
-
258
-
259
-
260
-
261
-
262
-
263
-
264
-
265
-
266
-
267
-
268
-
269
-
270
-
271
-
272
-
273
-
274
-
275
-
276
-
277
-
278
-
279
-
280
-
281
-
282
-
283
-
284
 |
 |

Bank of America 2013 93
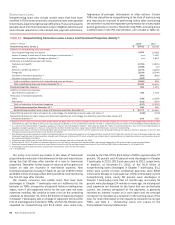
Table 50 Nonperforming Commercial Loans, Leases and Foreclosed Properties Activity (1, 2)
(Dollars in millions) 2013 2012
Nonperforming loans and leases, January 1 $ 3,224 $6,337
Additions to nonperforming loans and leases:
New nonperforming loans and leases 1,112 2,334
Advances 30 85
Reductions to nonperforming loans and leases:
Paydowns (1,342)(2,372)
Sales (498)(840)
Returns to performing status (3) (588)(808)
Charge-offs (549)(1,164)
Transfers to foreclosed properties (4) (54) (302)
Transfers to loans held-for-sale (26) (46)
Total net reductions to nonperforming loans and leases (1,915)(3,113)
Total nonperforming loans and leases, December 31 1,309 3,224
Foreclosed properties, January 1 250 612
Additions to foreclosed properties:
New foreclosed properties (4) 38 222
Reductions to foreclosed properties:
Sales (169)(516)
Write-downs (29) (68)
Total net reductions to foreclosed properties (160)(362)
Total foreclosed properties, December 31 90 250
Nonperforming commercial loans, leases and foreclosed properties, December 31 $ 1,399 $3,474
Nonperforming commercial loans and leases as a percentage of outstanding commercial loans and leases (5) 0.34%0.93%
Nonperforming commercial loans, leases and foreclosed properties as a percentage of outstanding commercial loans, leases and foreclosed
properties (5) 0.36 1.00
(1) Balances do not include nonperforming LHFS of $296 million and $437 million at December 31, 2013 and 2012.
(2) Includes U.S. small business commercial activity. Small business card loans are excluded as they are not classified as nonperforming.
(3) Commercial loans and leases may be returned to performing status when all principal and interest is current and full repayment of the remaining contractual principal and interest is expected or
when the loan otherwise becomes well-secured and is in the process of collection. TDRs are generally classified as performing after a sustained period of demonstrated payment performance.
(4) New foreclosed properties represents transfers of nonperforming loans to foreclosed properties net of charge-offs recorded during the first 90 days after transfer of a loan to foreclosed properties.
(5) Outstanding commercial loans exclude loans accounted for under the fair value option.
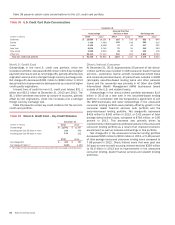
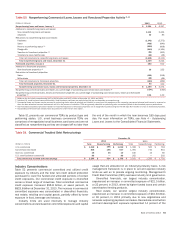
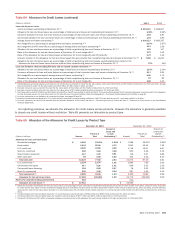
Table 51 presents our commercial TDRs by product type and
performing status. U.S. small business commercial TDRs are
comprised of renegotiated small business card loans and are not
classified as nonperforming as they are charged off no later than
the end of the month in which the loan becomes 180 days past
due. For more information on TDRs, see Note 4 – Outstanding
Loans and Leases to the Consolidated Financial Statements.
Table 51 Commercial Troubled Debt Restructurings
December 31
2013 2012
(Dollars in millions) Total Nonperforming Performing Total Nonperforming Performing
U.S. commercial $ 1,318 $ 298 $ 1,020 $ 1,328 $ 565 $ 763
Commercial real estate 835 198 637 1,391 740 651
Non-U.S. commercial 48 38 10 100 15 85
U.S. small business commercial 88 — 88 202 — 202
Total commercial troubled debt restructurings $ 2,289 $ 534 $ 1,755 $ 3,021 $ 1,320 $ 1,701
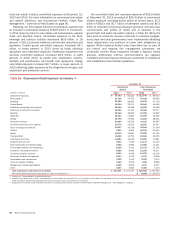
Industry Concentrations
Table 52 presents commercial committed and utilized credit
exposure by industry and the total net credit default protection
purchased to cover the funded and unfunded portions of certain
credit exposures. Our commercial credit exposure is diversified
across a broad range of industries. Total committed commercial
credit exposure increased $56.8 billion, or seven percent, to
$823.8 billion at December 31, 2013. The increase in commercial
committed exposure was concentrated in diversified financials,
real estate, retailing and capital goods, partially offset by lower
exposure in food, beverage and tobacco.
Industry limits are used internally to manage industry
concentrations and are based on committed exposures and capital
usage that are allocated on an industry-by-industry basis. A risk
management framework is in place to set and approve industry
limits as well as to provide ongoing monitoring. Management’s
Credit Risk Committee (CRC) oversees industry limit governance.
Diversified financials, our largest industry concentration,
experienced an increase in committed exposure of $21.5 billion,
or 22 percent, in 2013, driven by higher funded loans and certain
asset-backed lending products.
Real estate, our second largest industry concentration,
experienced an increase in committed exposure of $10.8 billion,
or 16 percent, in 2013 primarily due to new originations and
renewals outpacing paydowns and sales. Real estate construction
and land development exposure represented 14 percent of the