Bank of America 2013 Annual Report Download - page 103
Download and view the complete annual report
Please find page 103 of the 2013 Bank of America annual report below. You can navigate through the pages in the report by either clicking on the pages listed below, or by using the keyword search tool below to find specific information within the annual report.-
 1
1 -
2
-
3
-
4
-
5
-
6
-
7
-
8
-
9
-
10
-
11
-
12
-
13
-
14
-
15
-
16
-
17
-
18
-
19
-
20
-
21
-
22
-
23
-
24
-
25
-
26
-
27
-
28
-
29
-
30
-
31
-
32
-
33
-
34
-
35
-
36
-
37
-
38
-
39
-
40
-
41
-
42
-
43
-
44
-
45
-
46
-
47
-
48
-
49
-
50
-
51
-
52
-
53
-
54
-
55
-
56
-
57
-
58
-
59
-
60
-
61
-
62
-
63
-
64
-
65
-
66
-
67
-
68
-
69
-
70
-
71
-
72
-
73
-
74
-
75
-
76
-
77
-
78
-
79
-
80
-
81
-
82
-
83
-
84
-
85
-
86
-
87
-
88
-
89
-
90
-
91
-
92
-
 93
93 -
 94
94 -
 95
95 -
 96
96 -
 97
97 -
 98
98 -
 99
99 -
 100
100 -
 101
101 -
 102
102 -
 103
103 -
 104
104 -
 105
105 -
 106
106 -
 107
107 -
 108
108 -
 109
109 -
 110
110 -
 111
111 -
 112
112 -
 113
113 -
114
-
115
-
116
-
117
-
118
-
119
-
120
-
121
-
122
-
123
-
124
-
125
-
126
-
127
-
128
-
129
-
130
-
131
-
132
-
133
-
134
-
135
-
136
-
137
-
138
-
139
-
140
-
141
-
142
-
143
-
144
-
145
-
146
-
147
-
148
-
149
-
150
-
151
-
152
-
153
-
154
-
155
-
156
-
157
-
158
-
159
-
160
-
161
-
162
-
163
-
164
-
165
-
166
-
167
-
168
-
169
-
170
-
171
-
172
-
173
-
174
-
175
-
176
-
177
-
178
-
179
-
180
-
181
-
182
-
183
-
184
-
185
-
186
-
187
-
188
-
189
-
190
-
191
-
192
-
193
-
194
-
195
-
196
-
197
-
198
-
199
-
200
-
201
-
202
-
203
-
204
-
205
-
206
-
207
-
208
-
209
-
210
-
211
-
212
-
213
-
214
-
215
-
216
-
217
-
218
-
219
-
220
-
221
-
222
-
223
-
224
-
225
-
226
-
227
-
228
-
229
-
230
-
231
-
232
-
233
-
234
-
235
-
236
-
237
-
238
-
239
-
240
-
241
-
242
-
243
-
244
-
245
-
246
-
247
-
248
-
249
-
250
-
251
-
252
-
253
-
254
-
255
-
256
-
257
-
258
-
259
-
260
-
261
-
262
-
263
-
264
-
265
-
266
-
267
-
268
-
269
-
270
-
271
-
272
-
273
-
274
-
275
-
276
-
277
-
278
-
279
-
280
-
281
-
282
-
283
-
284
 |
 |
Bank of America 2013 101
lease losses. Further, we consider the inherent uncertainty in
mathematical models that are built upon historical data.
During 2013, the factors that impacted the allowance for loan
and lease losses included significant overall improvements in the
credit quality of the portfolios driven by improvements in the U.S.
economy and housing and labor markets, continuing proactive
credit risk management initiatives and the impact of recent higher
credit quality originations. Additionally, the resolution of
uncertainties through current recognition of net charge-offs has
impacted the amount of reserve needed in certain portfolios.
Evidencing the improvements in the U.S. economy and housing
and labor markets are modest growth in consumer spending,
improvements in unemployment levels, a decrease in the absolute
level and our share of national consumer bankruptcy filings, and
a rise in both residential building activity and overall home prices.
In addition to these improvements, paydowns, charge-offs, sales,
returns to performing status and upgrades out of criticized
continued to outpace new nonaccrual consumer loans and
reservable criticized commercial loans, but such loans remained
elevated relative to levels experienced prior to the financial crisis.
We monitor differences between estimated and actual incurred
loan and lease losses. This monitoring process includes periodic
assessments by senior management of loan and lease portfolios
and the models used to estimate incurred losses in those
portfolios.
Additions to, or reductions of, the allowance for loan and lease
losses generally are recorded through charges or credits to the
provision for credit losses. Credit exposures deemed to be
uncollectible are charged against the allowance for loan and lease
losses. Recoveries of previously charged off amounts are credited
to the allowance for loan and lease losses.
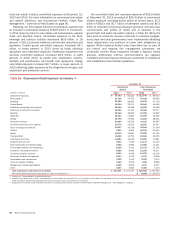
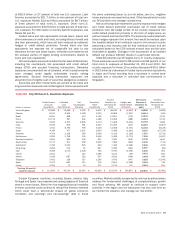
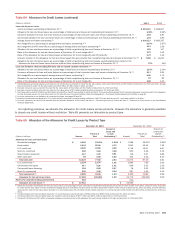
The allowance for loan and lease losses for the consumer
portfolio, as presented in Table 65, was $13.4 billion at
December 31, 2013, a decrease of $7.7 billion from
December 31, 2012. The decrease was primarily driven by the
home equity and residential mortgage portfolios due to improved
delinquencies and home prices as evidenced by improving LTV
statistics as presented in Tables 30 and 32 as well as continued
loan balance run-off. In addition, the home equity and residential
mortgage allowance declined due to write-offs in our PCI loan
portfolio. These write-offs decreased the PCI valuation allowance
included as part of the allowance for loan and lease losses.
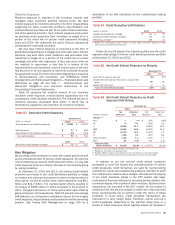
The decrease in the allowance related to the U.S. credit card
and unsecured consumer lending portfolios in CBB was primarily
due to improvement in delinquencies and bankruptcies. For
example, in the U.S. credit card portfolio, accruing loans 30 days
or more past due decreased to $2.1 billion at December 31, 2013
from $2.7 billion (to 2.25 percent from 2.90 percent of outstanding
U.S. credit card loans) at December 31, 2012, and accruing loans
90 days or more past due declined to $1.1 billion at December 31,
2013 from $1.4 billion (to 1.14 percent from 1.52 percent of
outstanding U.S. credit card loans) at December 31, 2012. See
Tables 27, 28, 37 and 39 for additional details on key credit
statistics for the credit card and other unsecured consumer lending
portfolios.
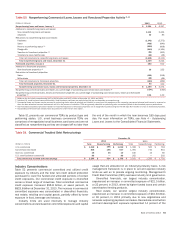
The allowance for loan and lease losses for the commercial
portfolio, as presented in Table 65, was $4.0 billion at
December 31, 2013, a $899 million increase from December 31,
2012, as continued improvement in credit quality was more than
offset by loan growth across the commercial portfolio. The
commercial utilized reservable criticized exposure decreased to
$12.9 billion at December 31, 2013 from $15.9 billion (to 3.02
percent from 4.10 percent of total commercial utilized reservable
exposure) at December 31, 2012. Similarly, nonperforming
commercial loans declined to $1.3 billion at December 31, 2013
from $3.2 billion (to 0.34 percent from 0.93 percent of outstanding
commercial loans) at December 31, 2012. See Tables 43, 44 and
46 for additional details on key commercial credit statistics.
The allowance for loan and lease losses as a percentage of
total loans and leases outstanding was 1.90 percent at
December 31, 2013 compared to 2.69 percent at December 31,
2012. The decrease in the ratio was primarily due to improved
credit quality driven by improved economic conditions and write-
offs in the PCI loan portfolio for home equity and residential
mortgage which led to the reduction in the allowance for credit
losses discussed above. The December 31, 2013 and 2012 ratios
above include the PCI loan portfolio. Excluding the PCI loan
portfolio, the allowance for loan and lease losses as a percentage
of total loans and leases outstanding was 1.67 percent at
December 31, 2013 compared to 2.14 percent at December 31,
2012.