Bank of America 2013 Annual Report Download - page 236
Download and view the complete annual report
Please find page 236 of the 2013 Bank of America annual report below. You can navigate through the pages in the report by either clicking on the pages listed below, or by using the keyword search tool below to find specific information within the annual report.-
 1
1 -
2
-
3
-
4
-
5
-
6
-
7
-
8
-
9
-
10
-
11
-
12
-
13
-
14
-
15
-
16
-
17
-
18
-
19
-
20
-
21
-
22
-
23
-
24
-
25
-
26
-
27
-
28
-
29
-
30
-
31
-
32
-
33
-
34
-
35
-
36
-
37
-
38
-
39
-
40
-
41
-
42
-
43
-
44
-
45
-
46
-
47
-
48
-
49
-
50
-
51
-
52
-
53
-
54
-
55
-
56
-
57
-
58
-
59
-
60
-
61
-
62
-
63
-
64
-
65
-
66
-
67
-
68
-
69
-
70
-
71
-
72
-
73
-
74
-
75
-
76
-
77
-
78
-
79
-
80
-
81
-
82
-
83
-
84
-
85
-
86
-
87
-
88
-
89
-
90
-
91
-
92
-
93
-
94
-
95
-
96
-
97
-
98
-
99
-
100
-
101
-
102
-
103
-
104
-
105
-
106
-
107
-
108
-
109
-
110
-
111
-
112
-
113
-
114
-
115
-
116
-
117
-
118
-
119
-
120
-
121
-
122
-
123
-
124
-
125
-
126
-
127
-
128
-
129
-
130
-
131
-
132
-
133
-
134
-
135
-
136
-
137
-
138
-
139
-
140
-
141
-
142
-
143
-
144
-
145
-
146
-
147
-
148
-
149
-
150
-
151
-
152
-
153
-
154
-
155
-
156
-
157
-
158
-
159
-
160
-
161
-
162
-
163
-
164
-
165
-
166
-
167
-
168
-
169
-
170
-
171
-
172
-
173
-
174
-
175
-
176
-
177
-
178
-
179
-
180
-
181
-
182
-
183
-
184
-
185
-
186
-
187
-
188
-
189
-
190
-
191
-
192
-
193
-
194
-
195
-
196
-
197
-
198
-
199
-
200
-
201
-
202
-
203
-
204
-
205
-
206
-
207
-
208
-
209
-
210
-
211
-
212
-
213
-
214
-
215
-
216
-
217
-
218
-
219
-
220
-
221
-
222
-
223
-
224
-
225
-
 226
226 -
 227
227 -
 228
228 -
 229
229 -
 230
230 -
 231
231 -
 232
232 -
 233
233 -
 234
234 -
 235
235 -
 236
236 -
 237
237 -
 238
238 -
 239
239 -
 240
240 -
 241
241 -
 242
242 -
 243
243 -
 244
244 -
 245
245 -
 246
246 -
247
-
248
-
249
-
250
-
251
-
252
-
253
-
254
-
255
-
256
-
257
-
258
-
259
-
260
-
261
-
262
-
263
-
264
-
265
-
266
-
267
-
268
-
269
-
270
-
271
-
272
-
273
-
274
-
275
-
276
-
277
-
278
-
279
-
280
-
281
-
282
-
283
-
284
 |
 |

234 Bank of America 2013
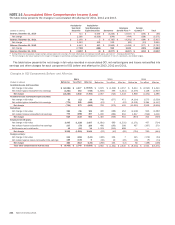
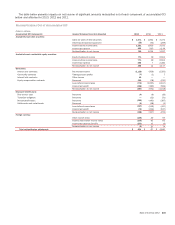
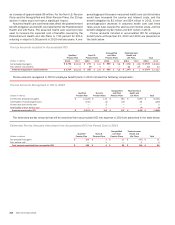
NOTE 14 Accumulated Other Comprehensive Income (Loss)
The table below presents the changes in accumulated OCI after-tax for 2011, 2012 and 2013.
(Dollars in millions)
Available-for-
Sale Debt
Securities
Available-for-
Sale Marketable
Equity Securities Derivatives
Employee
Benefit Plans (1)
Foreign
Currency (2) Total
Balance, December 31, 2010 $ 714 $ 6,659 $ (3,236) $ (3,947) $ (256) $ (66)
Net change 2,386 (6,656) (549) (444) (108) (5,371)
Balance, December 31, 2011 $ 3,100 $ 3 $ (3,785) $ (4,391) $ (364) $ (5,437)
Net change 1,343 459 916 (65) (13) 2,640
Balance, December 31, 2012 $ 4,443 $ 462 $ (2,869) $ (4,456) $ (377) $ (2,797)
Net change (7,700) (466) 592 2,049 (135) (5,660)
Balance, December 31, 2013 $ (3,257) $ (4) $ (2,277)$ (2,407)$ (512) $ (8,457)
(1) During 2013, the Corporation merged certain pension plans into one plan. For more information on employee benefit plans, see Note 17 – Employee Benefit Plans.
(2) The net change in fair value represents the impact of changes in spot foreign exchange rates on the Corporation’s net investment in non-U.S. operations, and related hedges.
The table below presents the net change in fair value recorded in accumulated OCI, net realized gains and losses reclassified into
earnings and other changes for each component of OCI before- and after-tax for 2013, 2012 and 2011.
Changes in OCI Components Before- and After-tax
2013 2012 2011
(Dollars in millions) Before-tax Tax effect After-tax Before-tax Tax effect After-tax Before-tax Tax effect After-tax
Available-for-sale debt securities:
Net change in fair value $ (10,989) $ 4,077 $ (6,912)$ 3,676 $ (1,319) $ 2,357 $ 6,913 $ (2,590) $ 4,323
Net realized gains reclassified into earnings (1,251) 463 (788) (1,609) 595 (1,014) (3,075) 1,138 (1,937)
Net change (12,240) 4,540 (7,700)2,067 (724) 1,343 3,838 (1,452) 2,386
Available-for-sale marketable equity securities:
Net change in fair value 32 (12) 20 748 (277) 471 (4,114) 1,575 (2,539)
Net realized gains reclassified into earnings (771) 285 (486) (19) 7 (12) (6,501) 2,384 (4,117)
Net change (739) 273 (466) 729 (270) 459 (10,615) 3,959 (6,656)
Derivatives:
Net change in fair value 156 (51) 105 430 (166) 264 (2,490) 923 (1,567)
Net realized losses reclassified into earnings 773 (286) 487 1,035 (383) 652 1,617 (599) 1,018
Net change 929 (337) 592 1,465 (549) 916 (873) 324 (549)
Employee benefit plans:
Net change in fair value 2,985 (1,128) 1,857 (1,891) 660 (1,231) (1,171) 457 (714)
Net realized losses reclassified into earnings 237 (79) 158 490 (192) 298 437 (167) 270
Settlements and curtailments 46 (12) 34 1,378 (510) 868 — — —
Net change 3,268 (1,219) 2,049 (23) (42) (65) (734) 290 (444)
Foreign currency:
Net change in fair value 244 (384) (140) (226) 233 7 145 (179) (34)
Net realized (gains) losses reclassified into earnings 138 (133) 5 (30) 10 (20) (65) (9) (74)
Net change 382 (517) (135) (256) 243 (13) 80 (188) (108)
Total other comprehensive income (loss) $ (8,400) $ 2,740 $ (5,660)$ 3,982 $ (1,342) $ 2,640 $ (8,304) $ 2,933 $ (5,371)