Bank of America 2013 Annual Report Download - page 154
Download and view the complete annual report
Please find page 154 of the 2013 Bank of America annual report below. You can navigate through the pages in the report by either clicking on the pages listed below, or by using the keyword search tool below to find specific information within the annual report.-
 1
1 -
2
-
3
-
4
-
5
-
6
-
7
-
8
-
9
-
10
-
11
-
12
-
13
-
14
-
15
-
16
-
17
-
18
-
19
-
20
-
21
-
22
-
23
-
24
-
25
-
26
-
27
-
28
-
29
-
30
-
31
-
32
-
33
-
34
-
35
-
36
-
37
-
38
-
39
-
40
-
41
-
42
-
43
-
44
-
45
-
46
-
47
-
48
-
49
-
50
-
51
-
52
-
53
-
54
-
55
-
56
-
57
-
58
-
59
-
60
-
61
-
62
-
63
-
64
-
65
-
66
-
67
-
68
-
69
-
70
-
71
-
72
-
73
-
74
-
75
-
76
-
77
-
78
-
79
-
80
-
81
-
82
-
83
-
84
-
85
-
86
-
87
-
88
-
89
-
90
-
91
-
92
-
93
-
94
-
95
-
96
-
97
-
98
-
99
-
100
-
101
-
102
-
103
-
104
-
105
-
106
-
107
-
108
-
109
-
110
-
111
-
112
-
113
-
114
-
115
-
116
-
117
-
118
-
119
-
120
-
121
-
122
-
123
-
124
-
125
-
126
-
127
-
128
-
129
-
130
-
131
-
132
-
133
-
134
-
135
-
136
-
137
-
138
-
139
-
140
-
141
-
142
-
143
-
 144
144 -
 145
145 -
 146
146 -
 147
147 -
 148
148 -
 149
149 -
 150
150 -
 151
151 -
 152
152 -
 153
153 -
 154
154 -
 155
155 -
 156
156 -
 157
157 -
 158
158 -
 159
159 -
 160
160 -
 161
161 -
 162
162 -
 163
163 -
 164
164 -
165
-
166
-
167
-
168
-
169
-
170
-
171
-
172
-
173
-
174
-
175
-
176
-
177
-
178
-
179
-
180
-
181
-
182
-
183
-
184
-
185
-
186
-
187
-
188
-
189
-
190
-
191
-
192
-
193
-
194
-
195
-
196
-
197
-
198
-
199
-
200
-
201
-
202
-
203
-
204
-
205
-
206
-
207
-
208
-
209
-
210
-
211
-
212
-
213
-
214
-
215
-
216
-
217
-
218
-
219
-
220
-
221
-
222
-
223
-
224
-
225
-
226
-
227
-
228
-
229
-
230
-
231
-
232
-
233
-
234
-
235
-
236
-
237
-
238
-
239
-
240
-
241
-
242
-
243
-
244
-
245
-
246
-
247
-
248
-
249
-
250
-
251
-
252
-
253
-
254
-
255
-
256
-
257
-
258
-
259
-
260
-
261
-
262
-
263
-
264
-
265
-
266
-
267
-
268
-
269
-
270
-
271
-
272
-
273
-
274
-
275
-
276
-
277
-
278
-
279
-
280
-
281
-
282
-
283
-
284
 |
 |

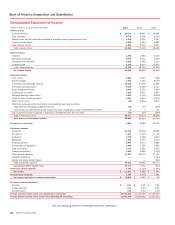
152 Bank of America 2013
Bank of America Corporation and Subsidiaries
Consolidated Statement of Changes in Shareholders’ Equity
Preferred
Stock
Common Stock and
Additional Paid-in
Capital Retained
Earnings
Accumulated
Other
Comprehensive
Income (Loss) Other
Total
Shareholders’
Equity
(Dollars in millions, shares in thousands) Shares Amount
Balance, December 31, 2010 $ 16,562 10,085,155 $150,905 $ 60,849 $ (66) $ (2) $ 228,248
Net income 1,446 1,446
Net change in available-for-sale debt and marketable
equity securities (4,270) (4,270)
Net change in derivatives (549) (549)
Employee benefit plan adjustments (444) (444)
Net change in foreign currency translation adjustments (108) (108)
Dividends paid:
Common (413) (413)
Preferred (1,325) (1,325)
Issuance of preferred stock and warrants 2,918 2,082 5,000
Common stock issued in connection with exchanges of
preferred stock and trust preferred securities (1,083) 400,000 2,754 (36) 1,635
Common stock issued under employee plans and
related tax effects 50,783 880 2 882
Other
(1) (1)
Balance, December 31, 2011 18,397 10,535,938 156,621 60,520 (5,437) — 230,101
Net income 4,188 4,188
Net change in available-for-sale debt and marketable
equity securities 1,802 1,802
Net change in derivatives 916 916
Employee benefit plan adjustments (65) (65)
Net change in foreign currency translation adjustments (13) (13)
Dividends paid:
Common (437) (437)
Preferred (1,472) (1,472)
Net Issuance of preferred stock 667 667
Common stock issued in connection with exchanges of
preferred stock and trust preferred securities (296) 49,867 412 44 160
Common stock issued under employee plans and
related tax effects 192.459 1,109 1,109
Balance, December 31, 2012 18,768 10,778,264 158,142 62,843 (2,797) — 236,956
Net income 11,431 11,431
Net change in available-for-sale debt and marketable
equity securities (8,166) (8,166)
Net change in derivatives 592 592
Employee benefit plan adjustments 2,049 2,049
Net change in foreign currency translation adjustments (135) (135)
Dividends paid:
Common (428) (428)
Preferred (1,249) (1,249)
Issuance of preferred stock 1,008 1,008
Redemption of preferred stock (6,461) (100) (6,561)
Common stock issued under employee plans and
related tax effects 45,288 371 371
Common stock repurchased (231,744) (3,220) (3,220)
Other 37 37
Balance, December 31, 2013 $ 13,352 10,591,808 $ 155,293 $ 72,497 $ (8,457) $ — $ 232,685
See accompanying Notes to Consolidated Financial Statements.