Bank of America 2013 Annual Report Download - page 244
Download and view the complete annual report
Please find page 244 of the 2013 Bank of America annual report below. You can navigate through the pages in the report by either clicking on the pages listed below, or by using the keyword search tool below to find specific information within the annual report.-
 1
1 -
2
-
3
-
4
-
5
-
6
-
7
-
8
-
9
-
10
-
11
-
12
-
13
-
14
-
15
-
16
-
17
-
18
-
19
-
20
-
21
-
22
-
23
-
24
-
25
-
26
-
27
-
28
-
29
-
30
-
31
-
32
-
33
-
34
-
35
-
36
-
37
-
38
-
39
-
40
-
41
-
42
-
43
-
44
-
45
-
46
-
47
-
48
-
49
-
50
-
51
-
52
-
53
-
54
-
55
-
56
-
57
-
58
-
59
-
60
-
61
-
62
-
63
-
64
-
65
-
66
-
67
-
68
-
69
-
70
-
71
-
72
-
73
-
74
-
75
-
76
-
77
-
78
-
79
-
80
-
81
-
82
-
83
-
84
-
85
-
86
-
87
-
88
-
89
-
90
-
91
-
92
-
93
-
94
-
95
-
96
-
97
-
98
-
99
-
100
-
101
-
102
-
103
-
104
-
105
-
106
-
107
-
108
-
109
-
110
-
111
-
112
-
113
-
114
-
115
-
116
-
117
-
118
-
119
-
120
-
121
-
122
-
123
-
124
-
125
-
126
-
127
-
128
-
129
-
130
-
131
-
132
-
133
-
134
-
135
-
136
-
137
-
138
-
139
-
140
-
141
-
142
-
143
-
144
-
145
-
146
-
147
-
148
-
149
-
150
-
151
-
152
-
153
-
154
-
155
-
156
-
157
-
158
-
159
-
160
-
161
-
162
-
163
-
164
-
165
-
166
-
167
-
168
-
169
-
170
-
171
-
172
-
173
-
174
-
175
-
176
-
177
-
178
-
179
-
180
-
181
-
182
-
183
-
184
-
185
-
186
-
187
-
188
-
189
-
190
-
191
-
192
-
193
-
194
-
195
-
196
-
197
-
198
-
199
-
200
-
201
-
202
-
203
-
204
-
205
-
206
-
207
-
208
-
209
-
210
-
211
-
212
-
213
-
214
-
215
-
216
-
217
-
218
-
219
-
220
-
221
-
222
-
223
-
224
-
225
-
226
-
227
-
228
-
229
-
230
-
231
-
232
-
233
-
 234
234 -
 235
235 -
 236
236 -
 237
237 -
 238
238 -
 239
239 -
 240
240 -
 241
241 -
 242
242 -
 243
243 -
 244
244 -
 245
245 -
 246
246 -
 247
247 -
 248
248 -
 249
249 -
 250
250 -
 251
251 -
 252
252 -
 253
253 -
 254
254 -
255
-
256
-
257
-
258
-
259
-
260
-
261
-
262
-
263
-
264
-
265
-
266
-
267
-
268
-
269
-
270
-
271
-
272
-
273
-
274
-
275
-
276
-
277
-
278
-
279
-
280
-
281
-
282
-
283
-
284
 |
 |

242 Bank of America 2013
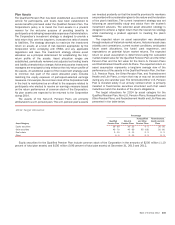
The discount rate assumption is based on a cash flow matching
technique and is subject to change each year. This technique
utilizes yield curves that are based on Aa-rated corporate bonds
with cash flows that match estimated benefit payments of each
of the plans to produce the discount rate assumptions. The asset
valuation method for the Qualified Pension Plan recognizes 60
percent of the prior year’s market gains or losses at the next
measurement date with the remaining 40 percent spread equally
over the subsequent four years.
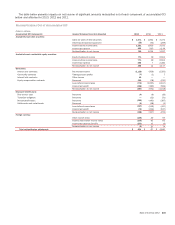
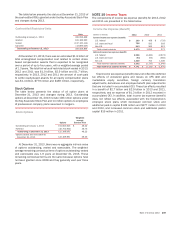
The Corporation’s best estimate of its contributions to be made
to the Non-U.S. Pension Plans, Nonqualified and Other Pension
Plans, and Postretirement Health and Life Plans in 2014 is $83
million, $103 million and $106 million, respectively. The
Corporation does not expect to make a contribution to the Qualified
Pension Plan in 2014.
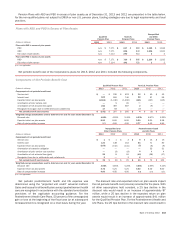
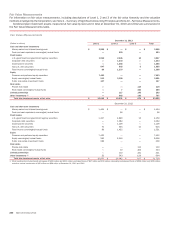
Pension and Postretirement Plans
Qualified
Pension Plan (1)
Non-U.S.
Pension Plans (1)
Nonqualified
and Other
Pension Plans (1)
Postretirement
Health and Life
Plans (1)
(Dollars in millions) 2013 2012 2013 2012 2013 2012 2013 2012
Change in fair value of plan assets
Fair value, January 1 $ 16,274 $ 15,070 $ 2,306 $ 2,022 $ 3,063 $ 3,061 $86 $91
Actual return on plan assets 2,873 2,020 146 115 (217) 126 910
Company contributions ——131 152 98 112 61 117
Plan participant contributions ——13——138 139
Settlements and curtailments ——(80) —(7) ———
Benefits paid (871) (816) (80) (77) (217) (236) (237)(290)
Federal subsidy on benefits paid n/a n/a n/a n/a n/a n/a 15 19
Foreign currency exchange rate changes n/a n/a 33 91 n/a n/a n/a n/a
Fair value, December 31 $ 18,276 $ 16,274 $ 2,457 $ 2,306 $ 2,720 $ 3,063 $72 $86
Change in projected benefit obligation
Projected benefit obligation, January 1 $ 15,655 $ 14,891 $ 2,460 $ 1,984 $ 3,334 $ 3,137 $ 1,574 $1,619
Service cost —236 32 40 11913
Interest cost 623 681 98 97 120 138 54 71
Plan participant contributions ——13——138 139
Plan amendments ——22————
Settlements and curtailments 17 (889) (116) —(7) ———
Actuarial loss (gain) (1,279) 1,552 156 328 (161) 294 (197)(4)
Benefits paid (871) (816) (80) (77) (217) (236) (237)(290)
Federal subsidy on benefits paid n/a n/a n/a n/a n/a n/a 15 19
Foreign currency exchange rate changes n/a n/a 27 83 n/a n/a —7
Projected benefit obligation, December 31 $ 14,145 $ 15,655 $ 2,580 $ 2,460 $ 3,070 $ 3,334 $ 1,356 $1,574
Amount recognized, December 31 $ 4,131 $ 619 $ (123) $ (154) $ (350) $ (271) $(1,284)$ (1,488)
Funded status, December 31
Accumulated benefit obligation $ 14,145 $ 15,655 $ 2,463 $ 2,345 $ 3,067 $ 3,334 n/a n/a
Overfunded (unfunded) status of ABO 4,131 619 (6) (39) (347) (271) n/a n/a
Provision for future salaries ——117 115 3—n/a n/a
Projected benefit obligation 14,145 15,655 2,580 2,460 3,070 3,334 $ 1,356 $1,574
Weighted-average assumptions, December 31
Discount rate 4.85% 4.00% 4.30%4.23% 4.55%3.65% 4.50%3.65%
Rate of compensation increase n/a n/a 3.40 4.37 4.00 4.00 n/a n/a
(1) The measurement date for the Qualified Pension Plan, Non-U.S. Pension Plans, Nonqualified and Other Pension Plans, and Postretirement Health and Life Plans was December 31 of each year
reported.
n/a = not applicable
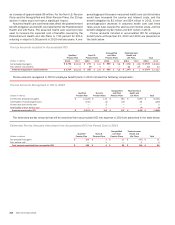
Amounts recognized on the Consolidated Balance Sheet at December 31, 2013 and 2012 are presented in the table below.
Amounts Recognized on Consolidated Balance Sheet
Qualified
Pension Plan
Non-U.S.
Pension Plans
Nonqualified
and Other
Pension Plans
Postretirement
Health and Life
Plans
(Dollars in millions) 2013 2012 2013 2012 2013 2012 2013 2012
Other assets $ 4,131 $ 676 $205 $ 220 $777 $ 908 $—$—
Accrued expenses and other liabilities —(57) (328) (374) (1,127)(1,179) (1,284)(1,488)
Net amount recognized at December 31 $ 4,131 $ 619 $ (123) $ (154) $ (350) $ (271) $(1,284)$ (1,488)