Bank of America 2013 Annual Report Download - page 41
Download and view the complete annual report
Please find page 41 of the 2013 Bank of America annual report below. You can navigate through the pages in the report by either clicking on the pages listed below, or by using the keyword search tool below to find specific information within the annual report.-
 1
1 -
2
-
3
-
4
-
5
-
6
-
7
-
8
-
9
-
10
-
11
-
12
-
13
-
14
-
15
-
16
-
17
-
18
-
19
-
20
-
21
-
22
-
23
-
24
-
25
-
26
-
27
-
28
-
29
-
30
-
 31
31 -
 32
32 -
 33
33 -
 34
34 -
 35
35 -
 36
36 -
 37
37 -
 38
38 -
 39
39 -
 40
40 -
 41
41 -
 42
42 -
 43
43 -
 44
44 -
 45
45 -
 46
46 -
 47
47 -
 48
48 -
 49
49 -
 50
50 -
 51
51 -
52
-
53
-
54
-
55
-
56
-
57
-
58
-
59
-
60
-
61
-
62
-
63
-
64
-
65
-
66
-
67
-
68
-
69
-
70
-
71
-
72
-
73
-
74
-
75
-
76
-
77
-
78
-
79
-
80
-
81
-
82
-
83
-
84
-
85
-
86
-
87
-
88
-
89
-
90
-
91
-
92
-
93
-
94
-
95
-
96
-
97
-
98
-
99
-
100
-
101
-
102
-
103
-
104
-
105
-
106
-
107
-
108
-
109
-
110
-
111
-
112
-
113
-
114
-
115
-
116
-
117
-
118
-
119
-
120
-
121
-
122
-
123
-
124
-
125
-
126
-
127
-
128
-
129
-
130
-
131
-
132
-
133
-
134
-
135
-
136
-
137
-
138
-
139
-
140
-
141
-
142
-
143
-
144
-
145
-
146
-
147
-
148
-
149
-
150
-
151
-
152
-
153
-
154
-
155
-
156
-
157
-
158
-
159
-
160
-
161
-
162
-
163
-
164
-
165
-
166
-
167
-
168
-
169
-
170
-
171
-
172
-
173
-
174
-
175
-
176
-
177
-
178
-
179
-
180
-
181
-
182
-
183
-
184
-
185
-
186
-
187
-
188
-
189
-
190
-
191
-
192
-
193
-
194
-
195
-
196
-
197
-
198
-
199
-
200
-
201
-
202
-
203
-
204
-
205
-
206
-
207
-
208
-
209
-
210
-
211
-
212
-
213
-
214
-
215
-
216
-
217
-
218
-
219
-
220
-
221
-
222
-
223
-
224
-
225
-
226
-
227
-
228
-
229
-
230
-
231
-
232
-
233
-
234
-
235
-
236
-
237
-
238
-
239
-
240
-
241
-
242
-
243
-
244
-
245
-
246
-
247
-
248
-
249
-
250
-
251
-
252
-
253
-
254
-
255
-
256
-
257
-
258
-
259
-
260
-
261
-
262
-
263
-
264
-
265
-
266
-
267
-
268
-
269
-
270
-
271
-
272
-
273
-
274
-
275
-
276
-
277
-
278
-
279
-
280
-
281
-
282
-
283
-
284
 |
 |

Bank of America 2013 39
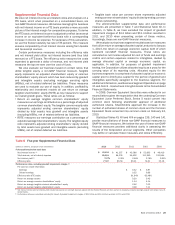
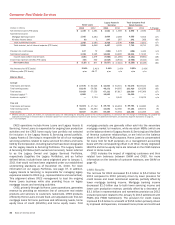
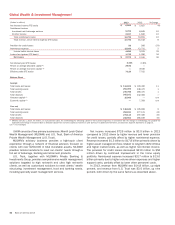
Core production revenue decreased $1.2 billion due to
industry-wide margin compression combined with lower loan
application volumes as described below.
The representations and warranties provision decreased $3.1
billion in 2013 to $840 million as 2012 included $2.5 billion in
provision related to the FNMA Settlement and $500 million for
obligations to FNMA related to MI rescissions. Net servicing
income decreased $2.9 billion to $2.9 billion driven by lower
servicing fees due to a smaller servicing portfolio, less favorable
MSR net-of-hedge performance and lower ancillary income due to
the divestiture of an ancillary business in 2012. The decline in
the size of our servicing portfolio was driven by strategic sales of
MSRs as well as loan prepayment activity, which exceeded new
originations primarily due to our exit from non-retail channels. For
more information on sales of MSRs, see Sales of Mortgage
Servicing Rights on page 39.
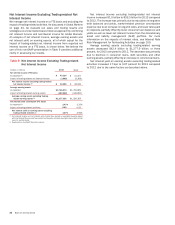
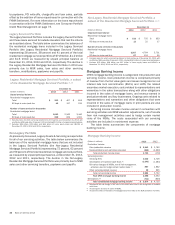
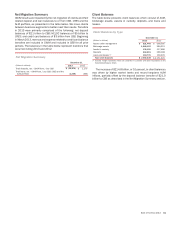
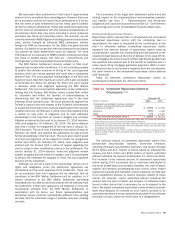
Key Statistics
(Dollars in millions, except as noted) 2013 2012
Loan production
Total Corporation (1):
First mortgage $ 83,421 $ 75,074
Home equity 6,355 3,585
CRES:
First mortgage $ 66,914 $ 55,518
Home equity 5,498 2,832
Year end
Mortgage serviced portfolio (in billions) (2, 3) $ 810 $ 1,332
Mortgage loans serviced for investors
(in billions) 550 1,045
Mortgage servicing rights:
Balance 5,042 5,716
Capitalized mortgage servicing rights
(% of loans serviced for investors) 92 bps 55 bps
(1) In addition to loan production in CRES, the remaining first mortgage and home equity loan
production is primarily in GWIM.
(2) Servicing of residential mortgage loans, HELOCs and home equity loans.
(3) Excludes loans for which servicing transferred to third parties as of December 31, 2013, with
an effective MSR sale date of January 2, 2014, totaling $220 million.
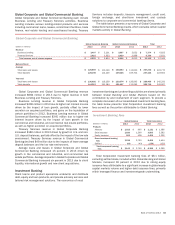
Despite a decline in the overall mortgage market because of
higher interest rates during the second half of 2013, first mortgage
loan originations in CRES increased $11.4 billion, or 21 percent,
to $66.9 billion in 2013, and for the total Corporation, increased
$8.3 billion to $83.4 billion as we increased market share due to
higher fulfillment capacity. The increase in interest rates also had
an adverse impact on our mortgage loan applications, particularly
for refinance mortgage loans. Our volume of mortgage applications
decreased 15 percent in 2013 corresponding to a decline in the
estimated overall U.S. demand for mortgages.
During 2013, 82 percent of our first mortgage production
volume was for refinance originations and 18 percent was for
purchase originations compared to 84 percent and 16 percent in
2012. HARP refinance originations were 23 percent of all refinance
originations compared to 31 percent in 2012. Making Home
Affordable non-HARP refinance originations were 19 percent of all
refinance originations as compared to 12 percent in 2012. The
remaining 58 percent of refinance originations was conventional
refinances, and remained relatively unchanged from 2012.
Home equity production was $6.4 billion for 2013 compared
to $3.6 billion for 2012 with the increase due to a higher demand
in the market based on improving housing trends, and increased
market share driven by improved banking center engagement with
customers and more competitive pricing.
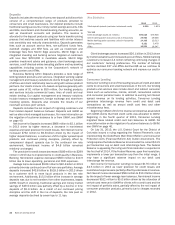
Mortgage Servicing Rights
At December 31, 2013, the consumer MSR balance was $5.0
billion, which represented 92 bps of the related unpaid principal
balance compared to $5.7 billion, or 55 bps of the related unpaid
principal balance at December 31, 2012. The consumer MSR
balance decreased $674 million during 2013 primarily driven by
MSR sales and the recognition of modeled cash flows. These
declines were partially offset by the increase in value driven by
higher mortgage rates, which resulted in lower forecasted
prepayment speeds and was the primary driver for the increase in
the MSRs as a percentage of unpaid principal balance. For more
information on our servicing activities, see Off-Balance Sheet
Arrangements and Contractual Obligations – Servicing,
Foreclosure and Other Mortgage Matters on page 53. For more
information on MSRs, see Note 23 – Mortgage Servicing Rights to
the Consolidated Financial Statements.
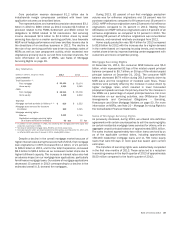
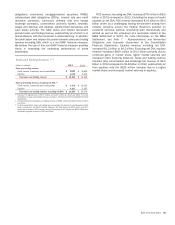
Sales of Mortgage Servicing Rights
As previously disclosed, during 2013, we entered into definitive
agreements with certain counterparties to sell the servicing rights
on certain residential mortgage loans serviced for others, with an
aggregate unpaid principal balance of approximately $301 billion.
The sales involved approximately two million loans serviced by us
as of the applicable contract dates, including approximately
180,000 residential mortgage loans and 11,700 home equity
loans that were 60 days or more past due based upon current
estimates.
The transfers of servicing rights were substantially completed
in the first nine months of 2013. These sales led to a reduction
in servicing revenue in the fourth quarter of 2013 of approximately
$150 million compared to the fourth quarter of 2012.