Bank of America 2013 Annual Report Download - page 109
Download and view the complete annual report
Please find page 109 of the 2013 Bank of America annual report below. You can navigate through the pages in the report by either clicking on the pages listed below, or by using the keyword search tool below to find specific information within the annual report.-
 1
1 -
2
-
3
-
4
-
5
-
6
-
7
-
8
-
9
-
10
-
11
-
12
-
13
-
14
-
15
-
16
-
17
-
18
-
19
-
20
-
21
-
22
-
23
-
24
-
25
-
26
-
27
-
28
-
29
-
30
-
31
-
32
-
33
-
34
-
35
-
36
-
37
-
38
-
39
-
40
-
41
-
42
-
43
-
44
-
45
-
46
-
47
-
48
-
49
-
50
-
51
-
52
-
53
-
54
-
55
-
56
-
57
-
58
-
59
-
60
-
61
-
62
-
63
-
64
-
65
-
66
-
67
-
68
-
69
-
70
-
71
-
72
-
73
-
74
-
75
-
76
-
77
-
78
-
79
-
80
-
81
-
82
-
83
-
84
-
85
-
86
-
87
-
88
-
89
-
90
-
91
-
92
-
93
-
94
-
95
-
96
-
97
-
98
-
 99
99 -
 100
100 -
 101
101 -
 102
102 -
 103
103 -
 104
104 -
 105
105 -
 106
106 -
 107
107 -
 108
108 -
 109
109 -
 110
110 -
 111
111 -
 112
112 -
 113
113 -
 114
114 -
 115
115 -
 116
116 -
 117
117 -
 118
118 -
 119
119 -
120
-
121
-
122
-
123
-
124
-
125
-
126
-
127
-
128
-
129
-
130
-
131
-
132
-
133
-
134
-
135
-
136
-
137
-
138
-
139
-
140
-
141
-
142
-
143
-
144
-
145
-
146
-
147
-
148
-
149
-
150
-
151
-
152
-
153
-
154
-
155
-
156
-
157
-
158
-
159
-
160
-
161
-
162
-
163
-
164
-
165
-
166
-
167
-
168
-
169
-
170
-
171
-
172
-
173
-
174
-
175
-
176
-
177
-
178
-
179
-
180
-
181
-
182
-
183
-
184
-
185
-
186
-
187
-
188
-
189
-
190
-
191
-
192
-
193
-
194
-
195
-
196
-
197
-
198
-
199
-
200
-
201
-
202
-
203
-
204
-
205
-
206
-
207
-
208
-
209
-
210
-
211
-
212
-
213
-
214
-
215
-
216
-
217
-
218
-
219
-
220
-
221
-
222
-
223
-
224
-
225
-
226
-
227
-
228
-
229
-
230
-
231
-
232
-
233
-
234
-
235
-
236
-
237
-
238
-
239
-
240
-
241
-
242
-
243
-
244
-
245
-
246
-
247
-
248
-
249
-
250
-
251
-
252
-
253
-
254
-
255
-
256
-
257
-
258
-
259
-
260
-
261
-
262
-
263
-
264
-
265
-
266
-
267
-
268
-
269
-
270
-
271
-
272
-
273
-
274
-
275
-
276
-
277
-
278
-
279
-
280
-
281
-
282
-
283
-
284
 |
 |

Bank of America 2013 107
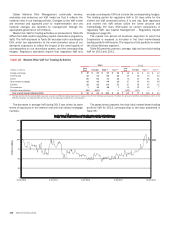
To enhance the visibility of the market risks to which we are
exposed, additional VaR statistics produced within the
Corporation’s single VaR model are provided in Table 67. Evaluating
VaR with additional statistics allows for an increased
understanding of the risks in the portfolio as the historical market
data used in the VaR calculation does not necessarily follow a
predefined statistical distribution. Table 67 presents average
trading VaR statistics for 99 percent and 95 percent confidence
intervals for 2013 and 2012.
Table 67 Average Market Risk VaR for Trading Activities – Additional VaR Statistics
2013 2012
(Dollars in millions) 99 percent 95 percent 99 percent 95 percent (1)
Foreign exchange $20$13 $21$ 12
Interest rate 34 20 46 26
Credit 53 23 50 24
Real estate/mortgage 28 17 34 18
Equities 29 16 28 16
Commodities 12 7 13 7
Portfolio diversification (107) (63) (117) (65)
Total market-based trading portfolio $69$33 $75$ 38
(1) Due to system constraints, the 95 percent VaR for the three months ended March 31, 2012 is not available and therefore average 95 percent VaR for that period has been estimated. It is not
expected that this estimation materially affected the average 95 percent VaR for 2012.
Limits on quantitative risk measures, including VaR, are
monitored on a daily basis. The trading limits are independently
set by market risk management and reviewed on a regular basis
to ensure they remain relevant and within our overall risk appetite
for market risks. Limits are reviewed in the context of market
liquidity, volatility and strategic business priorities. The limits are
set at both a granular level to ensure extensive coverage of risks
as well as at aggregated portfolios to account for correlations
among risk factors. Trading limits are approved at least annually.
The ALMRC has given authority to the GMRC to approve changes
to trading limits throughout the year. Approved trading limits are
stored and tracked in a centralized limits management system.
Trading limit excesses are communicated to management for
review. Certain quantitative market risk measures and
corresponding limits have been identified as critical in the
Corporation’s Risk Appetite Statement. These risk appetite limits
are monitored on a daily basis and are approved at least annually
by the Board. The market risk based risk appetite limits were not
exceeded during 2013.
In periods of market stress, the GMRC members communicate
daily to discuss losses, key risk positions and any limit excesses.
As a result of this process, the businesses may selectively reduce
risk. Where economically feasible, positions are sold or
macroeconomic hedges are executed to reduce the exposures.
Backtesting
The accuracy of the VaR methodology is evaluated by backtesting,
which compares the daily regulatory VaR results, utilizing a one-
day holding period, against the realized daily profit and loss.
Backtesting excesses occur when a trading loss exceeds the VaR
for the corresponding day. These excesses are evaluated to
understand the positions and market moves that produced the
trading loss and to ensure that the VaR methodology accurately
represents those losses. As our primary VaR statistic used for
backtesting is based on a 99 percent confidence interval and a
one-day holding period, we expect one trading loss in excess of
VaR every 100 days, or between two to three trading losses in
excess of VaR over the course of a year. The number of backtesting
excesses observed can differ from the statistically expected
number of excesses if the current level of market volatility is
materially different than the level of market volatility that existed
during the three years of historical data used in the VaR calculation.
We conduct daily backtesting on our portfolios and report the
results to senior market risk management. Senior management,
including the GMRC, regularly reviews and evaluates the results
of these tests. The government agencies that regulate our
operations also regularly review these results.
The revenue used for backtesting is defined by regulatory
agencies in order to most closely align with the VaR component
of the regulatory capital calculation. This revenue differs from total
trading-related revenue in that it excludes revenues from trading
activities that either do not generate market risk or the market
risk cannot be included in VaR. Some examples of the types of
revenue excluded for backtesting are fees, commissions, reserves,
net interest income and intraday trading revenues. In addition,
counterparty CVA is not included in the VaR component of the
regulatory capital calculation and is therefore not included in the
revenue used for backtesting.
There were no days with backtesting excesses for our total
market-based trading portfolio VaR, utilizing a holding period,
during 2013.
Total Trading Revenue
Total trading-related revenue, excluding brokerage fees, represents
the total amount earned from trading positions, including market-
based net interest income, which are taken in a diverse range of
financial instruments and markets. Trading account assets and
liabilities are reported at fair value. For more information on fair
value, see Note 20 – Fair Value Measurements to the Consolidated
Financial Statements. Trading-related revenues can be volatile and
are largely driven by general market conditions and customer
demand. Also, trading-related revenues are dependent on the
volume and type of transactions, the level of risk assumed, and
the volatility of price and rate movements at any given time within
the ever-changing market environment. Significant daily revenues
by business are monitored and the primary drivers of these are
reviewed. When it is deemed material, an explanation of these
revenues is provided to the GMRC.