Bank of America 2013 Annual Report Download - page 65
Download and view the complete annual report
Please find page 65 of the 2013 Bank of America annual report below. You can navigate through the pages in the report by either clicking on the pages listed below, or by using the keyword search tool below to find specific information within the annual report.-
 1
1 -
2
-
3
-
4
-
5
-
6
-
7
-
8
-
9
-
10
-
11
-
12
-
13
-
14
-
15
-
16
-
17
-
18
-
19
-
20
-
21
-
22
-
23
-
24
-
25
-
26
-
27
-
28
-
29
-
30
-
31
-
32
-
33
-
34
-
35
-
36
-
37
-
38
-
39
-
40
-
41
-
42
-
43
-
44
-
45
-
46
-
47
-
48
-
49
-
50
-
51
-
52
-
53
-
54
-
 55
55 -
 56
56 -
 57
57 -
 58
58 -
 59
59 -
 60
60 -
 61
61 -
 62
62 -
 63
63 -
 64
64 -
 65
65 -
 66
66 -
 67
67 -
 68
68 -
 69
69 -
 70
70 -
 71
71 -
 72
72 -
 73
73 -
 74
74 -
 75
75 -
76
-
77
-
78
-
79
-
80
-
81
-
82
-
83
-
84
-
85
-
86
-
87
-
88
-
89
-
90
-
91
-
92
-
93
-
94
-
95
-
96
-
97
-
98
-
99
-
100
-
101
-
102
-
103
-
104
-
105
-
106
-
107
-
108
-
109
-
110
-
111
-
112
-
113
-
114
-
115
-
116
-
117
-
118
-
119
-
120
-
121
-
122
-
123
-
124
-
125
-
126
-
127
-
128
-
129
-
130
-
131
-
132
-
133
-
134
-
135
-
136
-
137
-
138
-
139
-
140
-
141
-
142
-
143
-
144
-
145
-
146
-
147
-
148
-
149
-
150
-
151
-
152
-
153
-
154
-
155
-
156
-
157
-
158
-
159
-
160
-
161
-
162
-
163
-
164
-
165
-
166
-
167
-
168
-
169
-
170
-
171
-
172
-
173
-
174
-
175
-
176
-
177
-
178
-
179
-
180
-
181
-
182
-
183
-
184
-
185
-
186
-
187
-
188
-
189
-
190
-
191
-
192
-
193
-
194
-
195
-
196
-
197
-
198
-
199
-
200
-
201
-
202
-
203
-
204
-
205
-
206
-
207
-
208
-
209
-
210
-
211
-
212
-
213
-
214
-
215
-
216
-
217
-
218
-
219
-
220
-
221
-
222
-
223
-
224
-
225
-
226
-
227
-
228
-
229
-
230
-
231
-
232
-
233
-
234
-
235
-
236
-
237
-
238
-
239
-
240
-
241
-
242
-
243
-
244
-
245
-
246
-
247
-
248
-
249
-
250
-
251
-
252
-
253
-
254
-
255
-
256
-
257
-
258
-
259
-
260
-
261
-
262
-
263
-
264
-
265
-
266
-
267
-
268
-
269
-
270
-
271
-
272
-
273
-
274
-
275
-
276
-
277
-
278
-
279
-
280
-
281
-
282
-
283
-
284
 |
 |

Bank of America 2013 63
In 2013, we entered into an agreement with Berkshire
Hathaway, Inc. and its affiliates (Berkshire), who hold all the
outstanding shares of the Corporation’s 6% Cumulative Perpetual
Preferred Stock, Series T (Series T Preferred Stock) to amend the
terms of the Series T Preferred Stock. As of December 31, 2013,
the Series T Preferred Stock has a carrying value of $2.9 billion,
which does not qualify as Tier 1 capital. The material changes to
the terms of the Series T Preferred Stock proposed in the
amendment are: (1) dividends will no longer be cumulative; (2) the
dividend rate will be fixed at 6%; and (3) we may redeem the Series
T Preferred Stock only after the fifth anniversary of the effective
date of the amendment. Under Delaware law and our certificate
of incorporation, the amendment must be approved by the holders
of the Series T Preferred Stock, voting as a separate class, and a
majority of the outstanding shares of our common stock, Series
B Preferred Stock and Series 1 through 5 Preferred Stock, voting
together as a class. The amendment will be presented to our
stockholders for approval at the annual meeting of stockholders
scheduled to be held on May 7, 2014. Berkshire has granted us
an irrevocable proxy to vote their shares of Series T Preferred Stock
in favor of the amendment at the annual meeting. If our
stockholders approve the amendment and it becomes effective,
our Tier 1 capital will increase by approximately $2.9 billion, which
will benefit our Tier 1 capital and leverage ratios. We do not expect
any impact to our financial condition or results of operations as a
result of this amendment. For more information on the Series T
Preferred Stock, see Note 13 – Shareholders’ Equity to the
Consolidated Financial Statements.
At December 31, 2013, an increase or decrease in our Tier 1
common, Tier 1 or Total capital ratios by one bp would require a
change of $130 million in Tier 1 common, Tier 1 or Total capital.
We could also increase our Tier 1 common, Tier 1 or Total capital
ratios by one bp on such date by a reduction in risk-weighted assets
of $1.2 billion, $1.0 billion or $840 million, respectively. An
increase in our Tier 1 leverage ratio by one bp on such date would
require $205 million of additional Tier 1 capital or a reduction of
$2.6 billion in adjusted average assets.
Risk-weighted assets increased $91.6 billion in 2013 to
$1,298 billion at December 31, 2013. The increase was primarily
due to the net impact of the Basel 1 – 2013 Rules which increased
risk-weighted assets by approximately $87 billion and reduced the
Tier 1 common capital ratio by an estimated 77 bps. The Tier 1
leverage ratio increased 49 bps in 2013 primarily driven by the
increase in Tier 1 capital and a reduction in adjusted quarterly
average total assets.
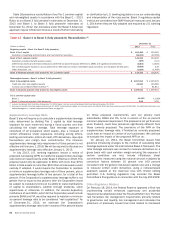
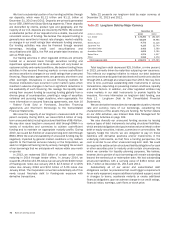
Table 15 presents Bank of America Corporation’s risk-weighted
assets activity for 2013.
Table 15 Risk-weighted Asset Activity
(Dollars in billions) 2013
Risk-weighted assets, January 1 $ 1,206
Changes to risk-weighted assets
Increase related to Comprehensive Risk Measure (1) 22
Increase related to Incremental Risk Charge (1) 7
Increase related to market risk regulatory VaR 21
Standard specific risk (2) 28
Increase due to items no longer eligible to be included in
market risk 9
Increases related to implementation of Basel 1 – 2013 Rules 87
Decrease related to trading and banking book exposures (3)
Other changes 8
Total risk-weighted assets, December 31 $ 1,298
(1) For additional information, see Capital Management – Regulatory Capital Changes on page 64.
(2) A measure of the risk of loss on a position that could result from factors other than broad
market movements.
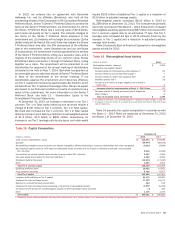
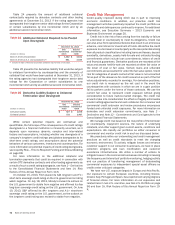
Table 16 presents the capital composition in accordance with
the Basel 1 – 2013 Rules as measured at December 31, 2013
and Basel 1 at December 31, 2012.
Table 16 Capital Composition
December 31
(Dollars in millions) 2013 2012
Total common shareholders’ equity $ 219,333 $ 218,188
Goodwill (69,844) (69,976)
Nonqualifying intangible assets (includes core deposit intangibles, affinity relationships, customer relationships and other intangibles) (4,263)(4,994)
Net unrealized (gains) losses on AFS debt and marketable equity securities and net losses on derivatives recorded in accumulated
OCI, net-of-tax 5,538 (2,036)
Unamortized net periodic benefit costs recorded in accumulated OCI, net-of-tax 2,407 4,456
Fair value adjustments related to structured liabilities (1) 4,485 4,084
Disallowed deferred tax asset (13,974) (17,940)
Other 1,553 1,621
Total Tier 1 common capital 145,235 133,403
Qualifying preferred stock 10,435 15,851
Trust preferred securities 5,786 6,207
Total Tier 1 capital 161,456 155,461
Long-term debt qualifying as Tier 2 capital 21,175 24,287
Allowance for loan and lease losses 17,428 24,179
Reserve for unfunded lending commitments 484 513
Allowance for loan and lease losses exceeding 1.25 percent of risk-weighted assets (1,637)(9,459)
45 percent of the pre-tax net unrealized gains (losses) on AFS marketable equity securities (3)329
Other 1,378 1,370
Total capital $ 200,281 $ 196,680
(1) Represents loss on structured liabilities, net-of-tax, that is excluded from Tier 1 common capital, Tier 1 capital and Total capital for regulatory capital purposes.