Bank of America 2013 Annual Report Download - page 49
Download and view the complete annual report
Please find page 49 of the 2013 Bank of America annual report below. You can navigate through the pages in the report by either clicking on the pages listed below, or by using the keyword search tool below to find specific information within the annual report.-
 1
1 -
2
-
3
-
4
-
5
-
6
-
7
-
8
-
9
-
10
-
11
-
12
-
13
-
14
-
15
-
16
-
17
-
18
-
19
-
20
-
21
-
22
-
23
-
24
-
25
-
26
-
27
-
28
-
29
-
30
-
31
-
32
-
33
-
34
-
35
-
36
-
37
-
38
-
 39
39 -
 40
40 -
 41
41 -
 42
42 -
 43
43 -
 44
44 -
 45
45 -
 46
46 -
 47
47 -
 48
48 -
 49
49 -
 50
50 -
 51
51 -
 52
52 -
 53
53 -
 54
54 -
 55
55 -
 56
56 -
 57
57 -
 58
58 -
 59
59 -
60
-
61
-
62
-
63
-
64
-
65
-
66
-
67
-
68
-
69
-
70
-
71
-
72
-
73
-
74
-
75
-
76
-
77
-
78
-
79
-
80
-
81
-
82
-
83
-
84
-
85
-
86
-
87
-
88
-
89
-
90
-
91
-
92
-
93
-
94
-
95
-
96
-
97
-
98
-
99
-
100
-
101
-
102
-
103
-
104
-
105
-
106
-
107
-
108
-
109
-
110
-
111
-
112
-
113
-
114
-
115
-
116
-
117
-
118
-
119
-
120
-
121
-
122
-
123
-
124
-
125
-
126
-
127
-
128
-
129
-
130
-
131
-
132
-
133
-
134
-
135
-
136
-
137
-
138
-
139
-
140
-
141
-
142
-
143
-
144
-
145
-
146
-
147
-
148
-
149
-
150
-
151
-
152
-
153
-
154
-
155
-
156
-
157
-
158
-
159
-
160
-
161
-
162
-
163
-
164
-
165
-
166
-
167
-
168
-
169
-
170
-
171
-
172
-
173
-
174
-
175
-
176
-
177
-
178
-
179
-
180
-
181
-
182
-
183
-
184
-
185
-
186
-
187
-
188
-
189
-
190
-
191
-
192
-
193
-
194
-
195
-
196
-
197
-
198
-
199
-
200
-
201
-
202
-
203
-
204
-
205
-
206
-
207
-
208
-
209
-
210
-
211
-
212
-
213
-
214
-
215
-
216
-
217
-
218
-
219
-
220
-
221
-
222
-
223
-
224
-
225
-
226
-
227
-
228
-
229
-
230
-
231
-
232
-
233
-
234
-
235
-
236
-
237
-
238
-
239
-
240
-
241
-
242
-
243
-
244
-
245
-
246
-
247
-
248
-
249
-
250
-
251
-
252
-
253
-
254
-
255
-
256
-
257
-
258
-
259
-
260
-
261
-
262
-
263
-
264
-
265
-
266
-
267
-
268
-
269
-
270
-
271
-
272
-
273
-
274
-
275
-
276
-
277
-
278
-
279
-
280
-
281
-
282
-
283
-
284
 |
 |

Bank of America 2013 47
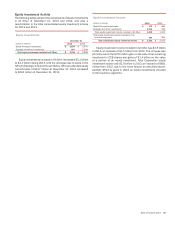
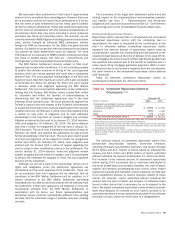
Equity Investment Activity
The following tables present the components of equity investments
in All Other at December 31, 2013 and 2012, and also a
reconciliation to the total consolidated equity investment income
for 2013 and 2012.
Equity Investments
December 31
(Dollars in millions) 2013 2012
Global Principal Investments $ 1,604 $ 3,470
Strategic and other investments 807 2,038
Total equity investments included in All Other $ 2,411 $ 5,508
Equity investments included in All Other decreased $3.1 billion
to $2.4 billion during 2013, with the decrease due to sales in the
GPI and Strategic investments portfolios. GPI had unfunded equity
commitments of $127 million at December 31, 2013 compared
to $224 million at December 31, 2012.
Equity Investment Income
(Dollars in millions) 2013 2012
Global Principal Investments $ 378 $ 589
Strategic and other investments 2,232 546
Total equity investment income included in All Other 2,610 1,135
Total equity investment income included in the
business segments 291 935
Total consolidated equity investment income $ 2,901 $ 2,070
Equity investment income included in All Other was $2.6 billion
in 2013, an increase of $1.5 billion from 2012. The increase was
primarily due to the $753 million gain on the sale of our remaining
investment in CCB shares and gains of $1.4 billion on the sales
of a portion of an equity investment. Total Corporation equity
investment income was $2.9 billion in 2013, an increase of $831
million from 2012, due to the same factors as described above,
partially offset by gains in 2012 on equity investments included
in the business segments.