Bank of America 2013 Annual Report Download - page 142
Download and view the complete annual report
Please find page 142 of the 2013 Bank of America annual report below. You can navigate through the pages in the report by either clicking on the pages listed below, or by using the keyword search tool below to find specific information within the annual report.-
 1
1 -
2
-
3
-
4
-
5
-
6
-
7
-
8
-
9
-
10
-
11
-
12
-
13
-
14
-
15
-
16
-
17
-
18
-
19
-
20
-
21
-
22
-
23
-
24
-
25
-
26
-
27
-
28
-
29
-
30
-
31
-
32
-
33
-
34
-
35
-
36
-
37
-
38
-
39
-
40
-
41
-
42
-
43
-
44
-
45
-
46
-
47
-
48
-
49
-
50
-
51
-
52
-
53
-
54
-
55
-
56
-
57
-
58
-
59
-
60
-
61
-
62
-
63
-
64
-
65
-
66
-
67
-
68
-
69
-
70
-
71
-
72
-
73
-
74
-
75
-
76
-
77
-
78
-
79
-
80
-
81
-
82
-
83
-
84
-
85
-
86
-
87
-
88
-
89
-
90
-
91
-
92
-
93
-
94
-
95
-
96
-
97
-
98
-
99
-
100
-
101
-
102
-
103
-
104
-
105
-
106
-
107
-
108
-
109
-
110
-
111
-
112
-
113
-
114
-
115
-
116
-
117
-
118
-
119
-
120
-
121
-
122
-
123
-
124
-
125
-
126
-
127
-
128
-
129
-
130
-
131
-
 132
132 -
 133
133 -
 134
134 -
 135
135 -
 136
136 -
 137
137 -
 138
138 -
 139
139 -
 140
140 -
 141
141 -
 142
142 -
 143
143 -
 144
144 -
 145
145 -
 146
146 -
 147
147 -
 148
148 -
 149
149 -
 150
150 -
 151
151 -
 152
152 -
153
-
154
-
155
-
156
-
157
-
158
-
159
-
160
-
161
-
162
-
163
-
164
-
165
-
166
-
167
-
168
-
169
-
170
-
171
-
172
-
173
-
174
-
175
-
176
-
177
-
178
-
179
-
180
-
181
-
182
-
183
-
184
-
185
-
186
-
187
-
188
-
189
-
190
-
191
-
192
-
193
-
194
-
195
-
196
-
197
-
198
-
199
-
200
-
201
-
202
-
203
-
204
-
205
-
206
-
207
-
208
-
209
-
210
-
211
-
212
-
213
-
214
-
215
-
216
-
217
-
218
-
219
-
220
-
221
-
222
-
223
-
224
-
225
-
226
-
227
-
228
-
229
-
230
-
231
-
232
-
233
-
234
-
235
-
236
-
237
-
238
-
239
-
240
-
241
-
242
-
243
-
244
-
245
-
246
-
247
-
248
-
249
-
250
-
251
-
252
-
253
-
254
-
255
-
256
-
257
-
258
-
259
-
260
-
261
-
262
-
263
-
264
-
265
-
266
-
267
-
268
-
269
-
270
-
271
-
272
-
273
-
274
-
275
-
276
-
277
-
278
-
279
-
280
-
281
-
282
-
283
-
284
 |
 |

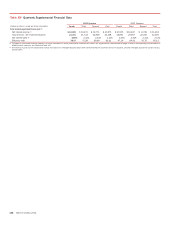
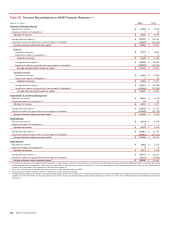
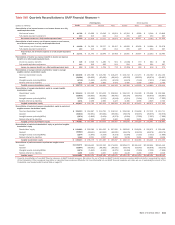
140 Bank of America 2013
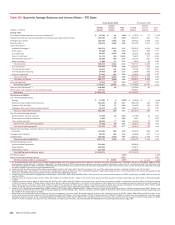
Table XVI Two-year Reconciliations to GAAP Financial Measures (1, 2)
(Dollars in millions) 2013 2012
Consumer & Business Banking
Reported net income $ 6,588 $ 5,546
Adjustment related to intangibles (3) 713
Adjusted net income $ 6,595 $ 5,559
Average allocated equity (4) $62,045 $ 56,214
Adjustment related to goodwill and a percentage of intangibles (32,045) (32,163)
Average allocated capital/economic capital $ 30,000 $ 24,051
Deposits
Reported net income $ 2,127 $ 1,261
Adjustment related to intangibles (3) 12
Adjusted net income $ 2,128 $ 1,263
Average allocated equity (4) $35,400 $ 33,006
Adjustment related to goodwill and a percentage of intangibles (20,000) (20,021)
Average allocated capital/economic capital $ 15,400 $ 12,985
Consumer Lending
Reported net income $ 4,461 $ 4,285
Adjustment related to intangibles (3) 712
Adjusted net income $ 4,468 $ 4,297
Average allocated equity (4) $26,644 $ 23,208
Adjustment related to goodwill and a percentage of intangibles (12,044) (12,142)
Average allocated capital/economic capital $ 14,600 $ 11,066
Global Wealth & Investment Management
Reported net income $ 2,974 $ 2,245
Adjustment related to intangibles (3) 16 22
Adjusted net income $ 2,990 $ 2,267
Average allocated equity (4) $20,292 $ 17,729
Adjustment related to goodwill and a percentage of intangibles (10,292) (10,370)
Average allocated capital/economic capital $ 10,000 $ 7,359
Global Banking
Reported net income $ 4,974 $ 5,344
Adjustment related to intangibles (3) 24
Adjusted net income $ 4,976 $ 5,348
Average allocated equity (4) $45,412 $ 41,742
Adjustment related to goodwill and a percentage of intangibles (22,412) (22,430)
Average allocated capital/economic capital $ 23,000 $ 19,312
Global Markets
Reported net income $ 1,563 $ 1,229
Adjustment related to intangibles (3) 89
Adjusted net income $ 1,571 $ 1,238
Average allocated equity (4) $35,373 $ 19,193
Adjustment related to goodwill and a percentage of intangibles (5,373)(5,369)
Average allocated capital/economic capital $ 30,000 $ 13,824
(1) Presents reconciliations of non-GAAP financial measures to GAAP financial measures. We believe the use of these non-GAAP financial measures provides additional clarity in assessing the results
of the Corporation and our segments. Other companies may define or calculate these measures differently. For more information on non-GAAP financial measures and ratios we use in assessing the
results of the Corporation, see Supplemental Financial Data on page 29.
(2) There are no adjustments to reported net income (loss) or average allocated equity for CRES.
(3) Represents cost of funds, earnings credits and certain expenses related to intangibles.
(4) Average allocated equity is comprised of average allocated capital (or economic capital prior to 2013) plus capital for the portion of goodwill and intangibles specifically assigned to the business
segment. For more information on allocated capital and economic capital, see Business Segment Operations on page 31 and Note 8 – Goodwill and Intangible Assets to the Consolidated Financial
Statements.