Bank of America 2013 Annual Report Download - page 122
Download and view the complete annual report
Please find page 122 of the 2013 Bank of America annual report below. You can navigate through the pages in the report by either clicking on the pages listed below, or by using the keyword search tool below to find specific information within the annual report.-
 1
1 -
2
-
3
-
4
-
5
-
6
-
7
-
8
-
9
-
10
-
11
-
12
-
13
-
14
-
15
-
16
-
17
-
18
-
19
-
20
-
21
-
22
-
23
-
24
-
25
-
26
-
27
-
28
-
29
-
30
-
31
-
32
-
33
-
34
-
35
-
36
-
37
-
38
-
39
-
40
-
41
-
42
-
43
-
44
-
45
-
46
-
47
-
48
-
49
-
50
-
51
-
52
-
53
-
54
-
55
-
56
-
57
-
58
-
59
-
60
-
61
-
62
-
63
-
64
-
65
-
66
-
67
-
68
-
69
-
70
-
71
-
72
-
73
-
74
-
75
-
76
-
77
-
78
-
79
-
80
-
81
-
82
-
83
-
84
-
85
-
86
-
87
-
88
-
89
-
90
-
91
-
92
-
93
-
94
-
95
-
96
-
97
-
98
-
99
-
100
-
101
-
102
-
103
-
104
-
105
-
106
-
107
-
108
-
109
-
110
-
111
-
 112
112 -
 113
113 -
 114
114 -
 115
115 -
 116
116 -
 117
117 -
 118
118 -
 119
119 -
 120
120 -
 121
121 -
 122
122 -
 123
123 -
 124
124 -
 125
125 -
 126
126 -
 127
127 -
 128
128 -
 129
129 -
 130
130 -
 131
131 -
 132
132 -
133
-
134
-
135
-
136
-
137
-
138
-
139
-
140
-
141
-
142
-
143
-
144
-
145
-
146
-
147
-
148
-
149
-
150
-
151
-
152
-
153
-
154
-
155
-
156
-
157
-
158
-
159
-
160
-
161
-
162
-
163
-
164
-
165
-
166
-
167
-
168
-
169
-
170
-
171
-
172
-
173
-
174
-
175
-
176
-
177
-
178
-
179
-
180
-
181
-
182
-
183
-
184
-
185
-
186
-
187
-
188
-
189
-
190
-
191
-
192
-
193
-
194
-
195
-
196
-
197
-
198
-
199
-
200
-
201
-
202
-
203
-
204
-
205
-
206
-
207
-
208
-
209
-
210
-
211
-
212
-
213
-
214
-
215
-
216
-
217
-
218
-
219
-
220
-
221
-
222
-
223
-
224
-
225
-
226
-
227
-
228
-
229
-
230
-
231
-
232
-
233
-
234
-
235
-
236
-
237
-
238
-
239
-
240
-
241
-
242
-
243
-
244
-
245
-
246
-
247
-
248
-
249
-
250
-
251
-
252
-
253
-
254
-
255
-
256
-
257
-
258
-
259
-
260
-
261
-
262
-
263
-
264
-
265
-
266
-
267
-
268
-
269
-
270
-
271
-
272
-
273
-
274
-
275
-
276
-
277
-
278
-
279
-
280
-
281
-
282
-
283
-
284
 |
 |

120 Bank of America 2013
2012 Compared to 2011
The following discussion and analysis provide a comparison of our
results of operations for 2012 and 2011. This discussion should
be read in conjunction with the Consolidated Financial Statements
and related Notes. Tables 7 and 8 contain financial data to
supplement this discussion.
Overview
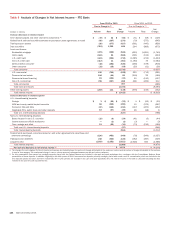
Net Income
Net income was $4.2 billion in 2012 compared to $1.4 billion in
2011. Including preferred stock dividends, net income applicable
to common shareholders was $2.8 billion, or $0.25 per diluted
share for 2012 and $85 million, or $0.01 per diluted share for
2011.
Net Interest Income
Net interest income on a FTE basis was $41.6 billion for 2012, a
decrease of $4.0 billion compared to 2011. The decline was
primarily due to lower consumer loan balances and yields,
recouponing of the ALM portfolio to a lower yield and decreased
commercial loan yields. Lower trading-related net interest income
also negatively impacted 2012 results. These decreases were
partially offset by ongoing reductions in long-term debt and lower
rates paid on deposits. The net interest yield on a FTE basis was
2.35 percent for 2012, a decrease of 13 bps compared to 2011
as the yield continued to be under pressure due to the
aforementioned items and the low rate environment.
Noninterest Income
Noninterest income was $42.7 billion in 2012, a decrease of $6.2
billion compared to 2011.
Card income decreased $1.1 billion primarily driven by the
implementation of interchange fee rules under the Durbin
Amendment, which became effective on October 1, 2011.
Service charges decreased $494 million primarily due to the
impact of lower accretion on acquired portfolios and reduced
reimbursed merchant processing fees.
Investment and brokerage services income decreased $433
million primarily driven by lower transactional volumes.
Equity investment income decreased $5.3 billion. The results
for 2012 included $1.6 billion of gains which primarily related
to the sales of certain equity and strategic investments. The
results for 2011 included $6.5 billion of gains on the sale of
CCB shares, $836 million of CCB dividends and a $377 million
gain on the sale of our investment in BlackRock, Inc., partially
offset by $1.1 billion of impairment charges on our merchant
services joint venture.
Trading account profits decreased $827 million. Net DVA losses
on derivatives were $2.5 billion in 2012 compared to net DVA
gains of $1.0 billion in 2011. Excluding net DVA, trading account
profits increased $2.7 billion in 2012 compared to 2011 due
to an improved market environment.
Mortgage banking income increased $13.6 billion primarily due
to an $11.7 billion decrease in the representations and
warranties provision. The 2012 results included $2.5 billion in
provision related to the FNMA Settlement, a $500 million
provision for obligations to FNMA related to MI rescissions,
partially offset by an increase in servicing income of $1.1 billion
due to improved MSR results. The 2011 results included $15.6
billion in representations and warranties provision related to the
agreement to resolve nearly all legacy Countrywide-issued first-
lien non-GSE RMBS repurchase exposures and other non-GSE
exposures.
Other income decreased $10.2 billion due to negative fair value
adjustments on our structured liabilities of $5.1 billion
compared to positive fair value adjustments of $3.3 billion in
2011. In addition, 2012 included $1.6 billion of gains related
to debt repurchases and exchanges of trust preferred securities
compared to gains of $1.2 billion in the prior year.
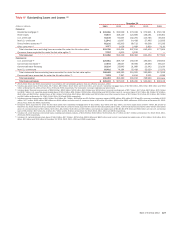
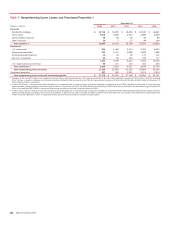
Provision for Credit Losses
The provision for credit losses was $8.2 billion for 2012, a
decrease of $5.2 billion compared to 2011. The provision for credit
losses was $6.7 billion lower than net charge-offs for 2012,
resulting in a reduction in the allowance for credit losses driven
by improved portfolio trends and increasing home prices in
consumer real estate products, lower bankruptcy filings and
delinquencies affecting the credit card portfolio, and improvement
in overall credit quality within the core commercial portfolio.
Net charge-offs totaled $14.9 billion, or 1.67 percent of
average loans and leases for 2012 compared to $20.8 billion, or
2.24 percent for 2011. The decrease in net charge-offs was
primarily driven by fewer delinquent loans and lower bankruptcy
filings in the credit card portfolio, as well as lower net charge-offs
in the consumer real estate and core commercial portfolios in
2012.
Noninterest Expense
Noninterest expense was $72.1 billion for 2012, a decrease of
$8.2 billion compared to 2011. The decrease was primarily driven
by $3.2 billion of goodwill impairment charges in 2011 and none
in 2012, a $2.8 billion decrease in other general operating expense
primarily related to lower litigation expense and mortgage-related
assessments, waivers and similar costs related to foreclosure
delays, partially offset by a provision of $1.1 billion in 2012 related
to the 2013 IFR Acceleration Agreement. Personnel expense
decreased $1.3 billion in 2012 as we continued to streamline
processes and achieve cost savings. Partially offsetting the
decreases were increases in professional fees and data
processing expenses due to continuing default management
activities in Legacy Assets & Servicing. Also, 2011 included $638
million in merger and restructuring charges.
Income Tax Benefit
The income tax benefit was $1.1 billion on pre-tax income of $3.1
billion for 2012 compared to an income tax benefit of $1.7 billion
on the pre-tax loss of $230 million for 2011. Included in the income
tax benefit for 2012 was a $1.7 billion tax benefit attributable to
the excess of foreign tax credits recognized in the U.S. upon
repatriation of the earnings of certain subsidiaries over the related
U.S. tax liability. Also included in the income tax benefit was a
$788 million charge to reduce the carrying value of certain U.K.
deferred tax assets due to the two percent U.K. corporate income
tax rate reduction enacted in 2012. Our effective tax rate for 2012
excluding these two items was a benefit of seven percent and
differed from the statutory rate due to the impact of our recurring
tax preference items (e.g., affordable housing credits and tax-
exempt income) on the level of pre-tax earnings.