Bank of America 2013 Annual Report Download - page 179
Download and view the complete annual report
Please find page 179 of the 2013 Bank of America annual report below. You can navigate through the pages in the report by either clicking on the pages listed below, or by using the keyword search tool below to find specific information within the annual report.-
 1
1 -
2
-
3
-
4
-
5
-
6
-
7
-
8
-
9
-
10
-
11
-
12
-
13
-
14
-
15
-
16
-
17
-
18
-
19
-
20
-
21
-
22
-
23
-
24
-
25
-
26
-
27
-
28
-
29
-
30
-
31
-
32
-
33
-
34
-
35
-
36
-
37
-
38
-
39
-
40
-
41
-
42
-
43
-
44
-
45
-
46
-
47
-
48
-
49
-
50
-
51
-
52
-
53
-
54
-
55
-
56
-
57
-
58
-
59
-
60
-
61
-
62
-
63
-
64
-
65
-
66
-
67
-
68
-
69
-
70
-
71
-
72
-
73
-
74
-
75
-
76
-
77
-
78
-
79
-
80
-
81
-
82
-
83
-
84
-
85
-
86
-
87
-
88
-
89
-
90
-
91
-
92
-
93
-
94
-
95
-
96
-
97
-
98
-
99
-
100
-
101
-
102
-
103
-
104
-
105
-
106
-
107
-
108
-
109
-
110
-
111
-
112
-
113
-
114
-
115
-
116
-
117
-
118
-
119
-
120
-
121
-
122
-
123
-
124
-
125
-
126
-
127
-
128
-
129
-
130
-
131
-
132
-
133
-
134
-
135
-
136
-
137
-
138
-
139
-
140
-
141
-
142
-
143
-
144
-
145
-
146
-
147
-
148
-
149
-
150
-
151
-
152
-
153
-
154
-
155
-
156
-
157
-
158
-
159
-
160
-
161
-
162
-
163
-
164
-
165
-
166
-
167
-
168
-
 169
169 -
 170
170 -
 171
171 -
 172
172 -
 173
173 -
 174
174 -
 175
175 -
 176
176 -
 177
177 -
 178
178 -
 179
179 -
 180
180 -
 181
181 -
 182
182 -
 183
183 -
 184
184 -
 185
185 -
 186
186 -
 187
187 -
 188
188 -
 189
189 -
190
-
191
-
192
-
193
-
194
-
195
-
196
-
197
-
198
-
199
-
200
-
201
-
202
-
203
-
204
-
205
-
206
-
207
-
208
-
209
-
210
-
211
-
212
-
213
-
214
-
215
-
216
-
217
-
218
-
219
-
220
-
221
-
222
-
223
-
224
-
225
-
226
-
227
-
228
-
229
-
230
-
231
-
232
-
233
-
234
-
235
-
236
-
237
-
238
-
239
-
240
-
241
-
242
-
243
-
244
-
245
-
246
-
247
-
248
-
249
-
250
-
251
-
252
-
253
-
254
-
255
-
256
-
257
-
258
-
259
-
260
-
261
-
262
-
263
-
264
-
265
-
266
-
267
-
268
-
269
-
270
-
271
-
272
-
273
-
274
-
275
-
276
-
277
-
278
-
279
-
280
-
281
-
282
-
283
-
284
 |
 |

Bank of America 2013 177
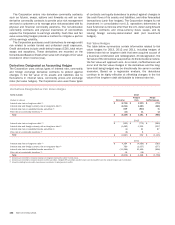
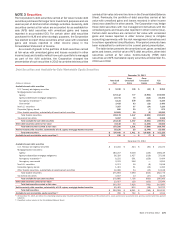
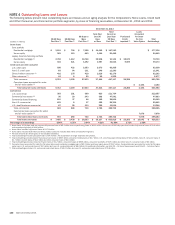
The table below presents the fair value and the associated gross unrealized losses on AFS debt securities and whether these
securities have had gross unrealized losses for less than 12 months or for 12 months or longer at December 31, 2013 and 2012.
Temporarily Impaired and Other-than-temporarily Impaired AFS Debt Securities
December 31, 2013
Less than Twelve Months Twelve Months or Longer Total
(Dollars in millions)
Fair
Value
Gross
Unrealized
Losses
Fair
Value
Gross
Unrealized
Losses
Fair
Value
Gross
Unrealized
Losses
Temporarily impaired available-for-sale debt securities
U.S. Treasury and agency securities $ 5,770 $ (61) $ 19 $ (1) $ 5,789 $ (62)
Mortgage-backed securities:
Agency 132,032 (5,457) 9,324 (497) 141,356 (5,954)
Agency-collateralized mortgage obligations 13,438 (210) 2,661 (105)16,099 (315)
Non-agency residential 819 (15) 1,237 (106) 2,056 (121)
Commercial 286 (12) — — 286 (12)
Non-U.S. securities ——45(24)
45 (24)
Corporate/Agency bonds 106 (3) 282 (4)388 (7)
Other taxable securities, substantially all asset-backed securities 116 (2) 280 (3)396 (5)
Total taxable securities 152,567 (5,760) 13,848 (740) 166,415 (6,500)
Tax-exempt securities 1,789 (30) 990 (19) 2,779 (49)
Total temporarily impaired available-for-sale debt securities 154,356 (5,790) 14,838 (759) 169,194 (6,549)
Other-than-temporarily impaired available-for-sale debt securities (1)
Non-agency residential mortgage-backed securities 2(1)1(1)3(2)
Total temporarily impaired and other-than-temporarily impaired available-for-
sale securities (2) $ 154,358 $ (5,791) $ 14,839 $ (760) $ 169,197 $ (6,551)
December 31, 2012
Temporarily impaired available-for-sale debt securities
U.S. Treasury and agency securities $ — $ — $ 5,608 $ (84) $ 5,608 $ (84)
Mortgage-backed securities:
Agency 15,593 (133) 735 (13) 16,328 (146)
Agency-collateralized mortgage obligations 5,135 (121) 4,994 (97) 10,129 (218)
Non-agency residential 592 (13) 1,555 (110) 2,147 (123)
Non-U.S. securities 1,715 (1) 563 (5) 2,278 (6)
Corporate/Agency bonds — — 277 (16) 277 (16)
Other taxable securities, substantially all asset-backed securities 1,678 (1) 1,436 (14) 3,114 (15)
Total taxable securities 24,713 (269) 15,168 (339) 39,881 (608)
Tax-exempt securities 1,609 (9) 1,072 (38) 2,681 (47)
Total temporarily impaired available-for-sale debt securities 26,322 (278) 16,240 (377) 42,562 (655)
Other-than-temporarily impaired available-for-sale debt securities (1)
Non-agency residential mortgage-backed securities 14 (1) 74 (4) 88 (5)
Total temporarily impaired and other-than-temporarily impaired available-for-
sale securities (2) $ 26,336 $ (279) $ 16,314 $ (381) $ 42,650 $ (660)
(1) Includes other-than-temporarily impaired AFS debt securities on which an OTTI loss remains in accumulated OCI.
(2) At December 31, 2013 and 2012, the amortized cost of approximately 4,700 and 2,600 AFS debt securities exceeded their fair value by $6.6 billion and $660 million.