Bank of America 2013 Annual Report Download - page 107
Download and view the complete annual report
Please find page 107 of the 2013 Bank of America annual report below. You can navigate through the pages in the report by either clicking on the pages listed below, or by using the keyword search tool below to find specific information within the annual report.-
 1
1 -
2
-
3
-
4
-
5
-
6
-
7
-
8
-
9
-
10
-
11
-
12
-
13
-
14
-
15
-
16
-
17
-
18
-
19
-
20
-
21
-
22
-
23
-
24
-
25
-
26
-
27
-
28
-
29
-
30
-
31
-
32
-
33
-
34
-
35
-
36
-
37
-
38
-
39
-
40
-
41
-
42
-
43
-
44
-
45
-
46
-
47
-
48
-
49
-
50
-
51
-
52
-
53
-
54
-
55
-
56
-
57
-
58
-
59
-
60
-
61
-
62
-
63
-
64
-
65
-
66
-
67
-
68
-
69
-
70
-
71
-
72
-
73
-
74
-
75
-
76
-
77
-
78
-
79
-
80
-
81
-
82
-
83
-
84
-
85
-
86
-
87
-
88
-
89
-
90
-
91
-
92
-
93
-
94
-
95
-
96
-
 97
97 -
 98
98 -
 99
99 -
 100
100 -
 101
101 -
 102
102 -
 103
103 -
 104
104 -
 105
105 -
 106
106 -
 107
107 -
 108
108 -
 109
109 -
 110
110 -
 111
111 -
 112
112 -
 113
113 -
 114
114 -
 115
115 -
 116
116 -
 117
117 -
118
-
119
-
120
-
121
-
122
-
123
-
124
-
125
-
126
-
127
-
128
-
129
-
130
-
131
-
132
-
133
-
134
-
135
-
136
-
137
-
138
-
139
-
140
-
141
-
142
-
143
-
144
-
145
-
146
-
147
-
148
-
149
-
150
-
151
-
152
-
153
-
154
-
155
-
156
-
157
-
158
-
159
-
160
-
161
-
162
-
163
-
164
-
165
-
166
-
167
-
168
-
169
-
170
-
171
-
172
-
173
-
174
-
175
-
176
-
177
-
178
-
179
-
180
-
181
-
182
-
183
-
184
-
185
-
186
-
187
-
188
-
189
-
190
-
191
-
192
-
193
-
194
-
195
-
196
-
197
-
198
-
199
-
200
-
201
-
202
-
203
-
204
-
205
-
206
-
207
-
208
-
209
-
210
-
211
-
212
-
213
-
214
-
215
-
216
-
217
-
218
-
219
-
220
-
221
-
222
-
223
-
224
-
225
-
226
-
227
-
228
-
229
-
230
-
231
-
232
-
233
-
234
-
235
-
236
-
237
-
238
-
239
-
240
-
241
-
242
-
243
-
244
-
245
-
246
-
247
-
248
-
249
-
250
-
251
-
252
-
253
-
254
-
255
-
256
-
257
-
258
-
259
-
260
-
261
-
262
-
263
-
264
-
265
-
266
-
267
-
268
-
269
-
270
-
271
-
272
-
273
-
274
-
275
-
276
-
277
-
278
-
279
-
280
-
281
-
282
-
283
-
284
 |
 |
Bank of America 2013 105
interest rate volatility. Our exposure to these instruments takes
several forms. First, we trade and engage in market-making
activities in a variety of mortgage securities including whole loans,
pass-through certificates, commercial mortgages and
collateralized mortgage obligations including CDOs using
mortgages as underlying collateral. Second, we originate a variety
of MBS which involves the accumulation of mortgage-related loans
in anticipation of eventual securitization. Third, we may hold
positions in mortgage securities and residential mortgage loans
as part of the ALM portfolio. Fourth, we create MSRs as part of
our mortgage origination activities. For more information on MSRs,
see Note 1 – Summary of Significant Accounting Principles and
Note 23 – Mortgage Servicing Rights to the Consolidated Financial
Statements. Hedging instruments used to mitigate this risk include
contracts and derivatives such as options, swaps, futures and
forwards. For additional information, see Mortgage Banking Risk
Management on page 112.
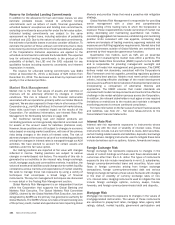
Equity Market Risk
Equity market risk represents exposures to securities that
represent an ownership interest in a corporation in the form of
domestic and foreign common stock or other equity-linked
instruments. Instruments that would lead to this exposure include,
but are not limited to, the following: common stock, exchange-
traded funds, American Depositary Receipts, convertible bonds,
listed equity options (puts and calls), OTC equity options, equity
total return swaps, equity index futures and other equity derivative
products. Hedging instruments used to mitigate this risk include
options, futures, swaps, convertible bonds and cash positions.
Commodity Risk
Commodity risk represents exposures to instruments traded in
the petroleum, natural gas, power and metals markets. These
instruments consist primarily of futures, forwards, swaps and
options. Hedging instruments used to mitigate this risk include
options, futures and swaps in the same or similar commodity
product, as well as cash positions.
Issuer Credit Risk
Issuer credit risk represents exposures to changes in the
creditworthiness of individual issuers or groups of issuers. Our
portfolio is exposed to issuer credit risk where the value of an
asset may be adversely impacted by changes in the levels of credit
spreads, by credit migration or by defaults. Hedging instruments
used to mitigate this risk include bonds, CDS and other credit
fixed-income instruments.
Market Liquidity Risk
Market liquidity risk represents the risk that the level of expected
market activity changes dramatically and, in certain cases, may
even cease. This exposes us to the risk that we will not be able
to transact business and execute trades in an orderly manner
which may impact our results. This impact could be further
exacerbated if expected hedging or pricing correlations are
compromised by disproportionate demand or lack of demand for
certain instruments. We utilize various risk mitigating techniques
as discussed in more detail in Trading Risk Management.
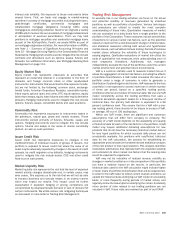
Trading Risk Management
To evaluate risk in our trading activities, we focus on the actual
and potential volatility of revenues generated by individual
positions as well as portfolios of positions. Various techniques
and procedures are utilized to enable the most complete
understanding of these risks. Quantitative measures of market
risk are evaluated on a daily basis from a single position to the
portfolio of the Corporation. These measures include sensitivities
of positions to various market risk factors, such as the potential
impact on revenue from a one basis point change in interest rates,
and statistical measures utilizing both actual and hypothetical
market moves, such as VaR and stress testing. Periods of extreme
market stress influence the reliability of these techniques to
varying degrees. Qualitative evaluations of market risk utilize the
suite of quantitative risk measures while understanding each of
their respective limitations. Additionally, risk managers
independently evaluate the risk of the portfolios under the current
market environment and potential future environments.
VaR is a common statistic used to measure market risk as it
allows the aggregation of market risk factors, including the effects
of portfolio diversification. A VaR model simulates the value of a
portfolio under a range of scenarios in order to generate a
distribution of potential gains and losses. VaR represents the loss
a portfolio is not expected to exceed more than a certain number
of times per period, based on a specified holding period,
confidence interval and window of historical data. We use one VaR
model consistently across the trading portfolios that uses a
historical simulation approach based on a three-year window of
historical data. Our primary VaR statistic is equivalent to a 99
percent confidence level. This means that for a VaR with a one-
day holding period, there should not be losses in excess of VaR,
on average, 99 out of 100 trading days.
Within any VaR model, there are significant and numerous
assumptions that will differ from company to company. The
accuracy of a VaR model depends on the availability and quality
of historical data for each of the risk factors in the portfolio. A VaR
model may require additional modeling assumptions for new
products that do not have the necessary historical market data or
for less liquid positions for which accurate daily prices are not
consistently available. For positions with insufficient historical
data for the VaR calculation, the process for establishing an
appropriate proxy is based on fundamental and statistical analysis
of the new product or less liquid position. This analysis identifies
reasonable alternatives that replicate both the expected volatility
and correlation to other market risk factors that the missing data
would be expected to experience.
VaR may not be indicative of realized revenue volatility as
changes in market conditions or in the composition of the portfolio
can have a material impact on the results. In particular, the
historical data used for the VaR calculation might indicate higher
or lower levels of portfolio diversification than will be experienced.
In order for the VaR model to reflect current market conditions, we
update the historical data underlying our VaR model on a bi-weekly
basis, or more frequently during periods of market stress, and
regularly review the assumptions underlying the model. A relatively
minor portion of risks related to our trading positions are not
included in VaR. These risks are reviewed as part of our ICAAP.