Bank of America 2013 Annual Report Download - page 248
Download and view the complete annual report
Please find page 248 of the 2013 Bank of America annual report below. You can navigate through the pages in the report by either clicking on the pages listed below, or by using the keyword search tool below to find specific information within the annual report.-
 1
1 -
2
-
3
-
4
-
5
-
6
-
7
-
8
-
9
-
10
-
11
-
12
-
13
-
14
-
15
-
16
-
17
-
18
-
19
-
20
-
21
-
22
-
23
-
24
-
25
-
26
-
27
-
28
-
29
-
30
-
31
-
32
-
33
-
34
-
35
-
36
-
37
-
38
-
39
-
40
-
41
-
42
-
43
-
44
-
45
-
46
-
47
-
48
-
49
-
50
-
51
-
52
-
53
-
54
-
55
-
56
-
57
-
58
-
59
-
60
-
61
-
62
-
63
-
64
-
65
-
66
-
67
-
68
-
69
-
70
-
71
-
72
-
73
-
74
-
75
-
76
-
77
-
78
-
79
-
80
-
81
-
82
-
83
-
84
-
85
-
86
-
87
-
88
-
89
-
90
-
91
-
92
-
93
-
94
-
95
-
96
-
97
-
98
-
99
-
100
-
101
-
102
-
103
-
104
-
105
-
106
-
107
-
108
-
109
-
110
-
111
-
112
-
113
-
114
-
115
-
116
-
117
-
118
-
119
-
120
-
121
-
122
-
123
-
124
-
125
-
126
-
127
-
128
-
129
-
130
-
131
-
132
-
133
-
134
-
135
-
136
-
137
-
138
-
139
-
140
-
141
-
142
-
143
-
144
-
145
-
146
-
147
-
148
-
149
-
150
-
151
-
152
-
153
-
154
-
155
-
156
-
157
-
158
-
159
-
160
-
161
-
162
-
163
-
164
-
165
-
166
-
167
-
168
-
169
-
170
-
171
-
172
-
173
-
174
-
175
-
176
-
177
-
178
-
179
-
180
-
181
-
182
-
183
-
184
-
185
-
186
-
187
-
188
-
189
-
190
-
191
-
192
-
193
-
194
-
195
-
196
-
197
-
198
-
199
-
200
-
201
-
202
-
203
-
204
-
205
-
206
-
207
-
208
-
209
-
210
-
211
-
212
-
213
-
214
-
215
-
216
-
217
-
218
-
219
-
220
-
221
-
222
-
223
-
224
-
225
-
226
-
227
-
228
-
229
-
230
-
231
-
232
-
233
-
234
-
235
-
236
-
237
-
 238
238 -
 239
239 -
 240
240 -
 241
241 -
 242
242 -
 243
243 -
 244
244 -
 245
245 -
 246
246 -
 247
247 -
 248
248 -
 249
249 -
 250
250 -
 251
251 -
 252
252 -
 253
253 -
 254
254 -
 255
255 -
 256
256 -
 257
257 -
 258
258 -
259
-
260
-
261
-
262
-
263
-
264
-
265
-
266
-
267
-
268
-
269
-
270
-
271
-
272
-
273
-
274
-
275
-
276
-
277
-
278
-
279
-
280
-
281
-
282
-
283
-
284
 |
 |

246 Bank of America 2013
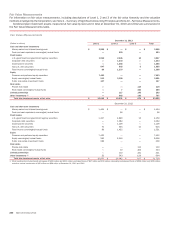
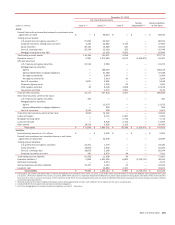
Fair Value Measurements
For information on fair value measurements, including descriptions of Level 1, 2 and 3 of the fair value hierarchy and the valuation
methods employed by the Corporation, see Note 1 – Summary of Significant Accounting Principles and Note 20 – Fair Value Measurements.
Combined plan investment assets measured at fair value by level and in total at December 31, 2013 and 2012 are summarized in
the Fair Value Measurements table.
Fair Value Measurements
December 31, 2013
(Dollars in millions) Level 1 Level 2 Level 3 Total
Cash and short-term investments
Money market and interest-bearing cash $ 2,586 $ — $ —$ 2,586
Cash and cash equivalent commingled/mutual funds —223 — 223
Fixed income
U.S. government and government agency securities 1,590 2,245 12 3,847
Corporate debt securities — 1,233 —1,233
Asset-backed securities — 1,455 —1,455
Non-U.S. debt securities 547 502 6 1,055
Fixed income commingled/mutual funds 89 1,279 —1,368
Equity
Common and preferred equity securities 7,463 — —7,463
Equity commingled/mutual funds 213 2,308 —2,521
Public real estate investment trusts 127 ——127
Real estate
Private real estate ——
119 119
Real estate commingled/mutual funds —7
462 469
Limited partnerships — 117 145 262
Other investments (1) —662 135 797
Total plan investment assets, at fair value $ 12,615 $ 10,031 $ 879 $ 23,525
December 31, 2012
Cash and short-term investments
Money market and interest-bearing cash $ 1,404 $ — $ — $ 1,404
Cash and cash equivalent commingled/mutual funds — 96 — 96
Fixed income
U.S. government and government agency securities 1,317 2,829 13 4,159
Corporate debt securities — 1,062 — 1,062
Asset-backed securities — 1,109 — 1,109
Non-U.S. debt securities 70 535 10 615
Fixed income commingled/mutual funds 99 1,432 — 1,531
Equity
Common and preferred equity securities 7,432 — — 7,432
Equity commingled/mutual funds 290 2,316 — 2,606
Public real estate investment trusts 236 — — 236
Real estate
Private real estate — — 110 110
Real estate commingled/mutual funds — 10 324 334
Limited partnerships — 110 231 341
Other investments (1) 22 543 129 694
Total plan investment assets, at fair value $ 10,870 $ 10,042 $ 817 $ 21,729
(1) Other investments include interest rate swaps of $435 million and $311 million, participant loans of $87 million and $76 million, commodity and balanced funds of $229 million and $239 million
and other various investments of $46 million and $68 million at December 31, 2013 and 2012.