Bank of America 2013 Annual Report Download - page 86
Download and view the complete annual report
Please find page 86 of the 2013 Bank of America annual report below. You can navigate through the pages in the report by either clicking on the pages listed below, or by using the keyword search tool below to find specific information within the annual report.-
 1
1 -
2
-
3
-
4
-
5
-
6
-
7
-
8
-
9
-
10
-
11
-
12
-
13
-
14
-
15
-
16
-
17
-
18
-
19
-
20
-
21
-
22
-
23
-
24
-
25
-
26
-
27
-
28
-
29
-
30
-
31
-
32
-
33
-
34
-
35
-
36
-
37
-
38
-
39
-
40
-
41
-
42
-
43
-
44
-
45
-
46
-
47
-
48
-
49
-
50
-
51
-
52
-
53
-
54
-
55
-
56
-
57
-
58
-
59
-
60
-
61
-
62
-
63
-
64
-
65
-
66
-
67
-
68
-
69
-
70
-
71
-
72
-
73
-
74
-
75
-
 76
76 -
 77
77 -
 78
78 -
 79
79 -
 80
80 -
 81
81 -
 82
82 -
 83
83 -
 84
84 -
 85
85 -
 86
86 -
 87
87 -
 88
88 -
 89
89 -
 90
90 -
 91
91 -
 92
92 -
 93
93 -
 94
94 -
 95
95 -
 96
96 -
97
-
98
-
99
-
100
-
101
-
102
-
103
-
104
-
105
-
106
-
107
-
108
-
109
-
110
-
111
-
112
-
113
-
114
-
115
-
116
-
117
-
118
-
119
-
120
-
121
-
122
-
123
-
124
-
125
-
126
-
127
-
128
-
129
-
130
-
131
-
132
-
133
-
134
-
135
-
136
-
137
-
138
-
139
-
140
-
141
-
142
-
143
-
144
-
145
-
146
-
147
-
148
-
149
-
150
-
151
-
152
-
153
-
154
-
155
-
156
-
157
-
158
-
159
-
160
-
161
-
162
-
163
-
164
-
165
-
166
-
167
-
168
-
169
-
170
-
171
-
172
-
173
-
174
-
175
-
176
-
177
-
178
-
179
-
180
-
181
-
182
-
183
-
184
-
185
-
186
-
187
-
188
-
189
-
190
-
191
-
192
-
193
-
194
-
195
-
196
-
197
-
198
-
199
-
200
-
201
-
202
-
203
-
204
-
205
-
206
-
207
-
208
-
209
-
210
-
211
-
212
-
213
-
214
-
215
-
216
-
217
-
218
-
219
-
220
-
221
-
222
-
223
-
224
-
225
-
226
-
227
-
228
-
229
-
230
-
231
-
232
-
233
-
234
-
235
-
236
-
237
-
238
-
239
-
240
-
241
-
242
-
243
-
244
-
245
-
246
-
247
-
248
-
249
-
250
-
251
-
252
-
253
-
254
-
255
-
256
-
257
-
258
-
259
-
260
-
261
-
262
-
263
-
264
-
265
-
266
-
267
-
268
-
269
-
270
-
271
-
272
-
273
-
274
-
275
-
276
-
277
-
278
-
279
-
280
-
281
-
282
-
283
-
284
 |
 |

84 Bank of America 2013
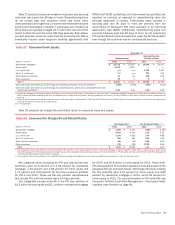
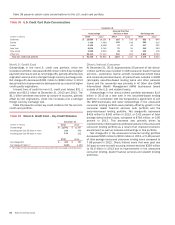
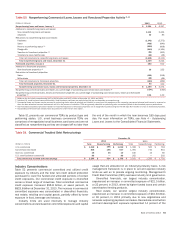
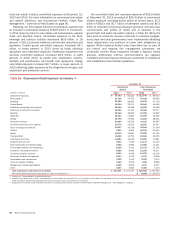
Table 38 presents certain state concentrations for the U.S. credit card portfolio.
Table 38 U.S. Credit Card State Concentrations
December 31
Outstandings
Accruing Past Due
90 Days or More Net Charge-offs
(Dollars in millions) 2013 2012 2013 2012 2013 2012
California $ 13,689 $ 14,101 $162 $ 235 $562 $ 840
Florida 7,339 7,469 105 149 359 512
Texas 6,405 6,448 72 92 217 290
New York 5,624 5,746 70 91 219 263
New Jersey 3,868 3,959 48 60 150 178
Other U.S. 55,413 57,112 596 810 1,869 2,549
Total U.S. credit card portfolio $ 92,338 $ 94,835 $ 1,053 $ 1,437 $ 3,376 $ 4,632
Non-U.S. Credit Card
Outstandings in the non-U.S. credit card portfolio, which are
recorded in All Other, decreased $156 million in 2013 due to higher
payment volumes as well as net charge-offs, partially offset by new
origination volume and a stronger foreign currency exchange rate.
Net charge-offs decreased $182 million to $399 million in 2013
due primarily to improvement in delinquencies as a result of higher
credit quality originations.
Unused lines of credit for non-U.S. credit card totaled $31.1
billion and $32.2 billion at December 31, 2013 and 2012. The
$1.1 billion decrease was driven by closure of accounts, partially
offset by new originations, credit line increases and a stronger
foreign currency exchange rate.
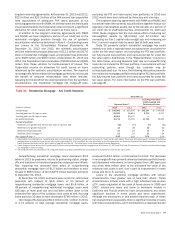
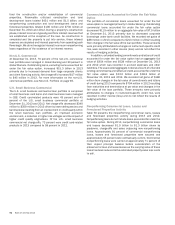
Table 39 presents certain key credit statistics for the non-U.S.
credit card portfolio.
Table 39 Non-U.S. Credit Card – Key Credit Statistics
December 31
(Dollars in millions) 2013 2012
Outstandings $ 11,541 $ 11,697
Accruing past due 30 days or more 248 403
Accruing past due 90 days or more 131 212
2013 2012
Net charge-offs $ 399 $ 581
Net charge-off ratios (1) 3.68% 4.29%
(1) Net charge-off ratios are calculated as net charge-offs divided by average outstanding loans.
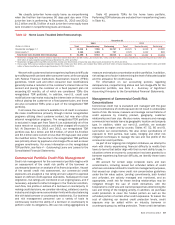
Direct/Indirect Consumer
At December 31, 2013, approximately 50 percent of the direct/
indirect portfolio was included in CBB (consumer dealer financial
services – automotive, marine, aircraft, recreational vehicle loans
and consumer personal loans), 43 percent was included in GWIM
(principally securities-based lending loans and other personal
loans) and the remainder was primarily in All Other (the GWIM
International Wealth Management (IWM) businesses based
outside of the U.S. and student loans).
Outstandings in the direct/indirect portfolio decreased $1.0
billion in 2013 as a loan sale in the securities-based lending
portfolio in connection with the Corporation’s agreement to sell
the IWM businesses and lower outstandings in the unsecured
consumer lending portfolio were partially offset by growth in the
consumer dealer financial services auto portfolio and the
securities-based lending portfolio. Net charge-offs decreased
$418 million to $345 million in 2013, or 0.42 percent of total
average direct/indirect loans, compared to $763 million, or 0.90
percent in 2012. This decrease was primarily driven by
improvements in delinquencies and bankruptcies in the unsecured
consumer lending portfolio as a result of an improved economic
environment as well as reduced outstandings in this portfolio.
Net charge-offs in the unsecured consumer lending portfolio
decreased $295 million to $190 million in 2013, or 5.26 percent
of total average unsecured consumer lending loans compared to
7.68 percent in 2012. Direct/indirect loans that were past due
30 days or more and still accruing interest declined $339 million
to $1.0 billion in 2013 due to improvements in the unsecured
consumer lending, dealer financial services and student lending
portfolios.