Bank of America 2013 Annual Report Download - page 138
Download and view the complete annual report
Please find page 138 of the 2013 Bank of America annual report below. You can navigate through the pages in the report by either clicking on the pages listed below, or by using the keyword search tool below to find specific information within the annual report.-
 1
1 -
2
-
3
-
4
-
5
-
6
-
7
-
8
-
9
-
10
-
11
-
12
-
13
-
14
-
15
-
16
-
17
-
18
-
19
-
20
-
21
-
22
-
23
-
24
-
25
-
26
-
27
-
28
-
29
-
30
-
31
-
32
-
33
-
34
-
35
-
36
-
37
-
38
-
39
-
40
-
41
-
42
-
43
-
44
-
45
-
46
-
47
-
48
-
49
-
50
-
51
-
52
-
53
-
54
-
55
-
56
-
57
-
58
-
59
-
60
-
61
-
62
-
63
-
64
-
65
-
66
-
67
-
68
-
69
-
70
-
71
-
72
-
73
-
74
-
75
-
76
-
77
-
78
-
79
-
80
-
81
-
82
-
83
-
84
-
85
-
86
-
87
-
88
-
89
-
90
-
91
-
92
-
93
-
94
-
95
-
96
-
97
-
98
-
99
-
100
-
101
-
102
-
103
-
104
-
105
-
106
-
107
-
108
-
109
-
110
-
111
-
112
-
113
-
114
-
115
-
116
-
117
-
118
-
119
-
120
-
121
-
122
-
123
-
124
-
125
-
126
-
127
-
 128
128 -
 129
129 -
 130
130 -
 131
131 -
 132
132 -
 133
133 -
 134
134 -
 135
135 -
 136
136 -
 137
137 -
 138
138 -
 139
139 -
 140
140 -
 141
141 -
 142
142 -
 143
143 -
 144
144 -
 145
145 -
 146
146 -
 147
147 -
 148
148 -
149
-
150
-
151
-
152
-
153
-
154
-
155
-
156
-
157
-
158
-
159
-
160
-
161
-
162
-
163
-
164
-
165
-
166
-
167
-
168
-
169
-
170
-
171
-
172
-
173
-
174
-
175
-
176
-
177
-
178
-
179
-
180
-
181
-
182
-
183
-
184
-
185
-
186
-
187
-
188
-
189
-
190
-
191
-
192
-
193
-
194
-
195
-
196
-
197
-
198
-
199
-
200
-
201
-
202
-
203
-
204
-
205
-
206
-
207
-
208
-
209
-
210
-
211
-
212
-
213
-
214
-
215
-
216
-
217
-
218
-
219
-
220
-
221
-
222
-
223
-
224
-
225
-
226
-
227
-
228
-
229
-
230
-
231
-
232
-
233
-
234
-
235
-
236
-
237
-
238
-
239
-
240
-
241
-
242
-
243
-
244
-
245
-
246
-
247
-
248
-
249
-
250
-
251
-
252
-
253
-
254
-
255
-
256
-
257
-
258
-
259
-
260
-
261
-
262
-
263
-
264
-
265
-
266
-
267
-
268
-
269
-
270
-
271
-
272
-
273
-
274
-
275
-
276
-
277
-
278
-
279
-
280
-
281
-
282
-
283
-
284
 |
 |

136 Bank of America 2013
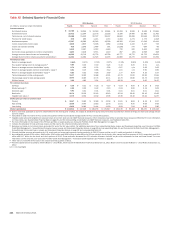
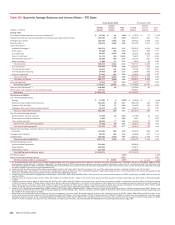
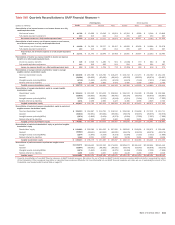
Table XIII Quarterly Average Balances and Interest Rates – FTE Basis
Fourth Quarter 2013 Third Quarter 2013
(Dollars in millions)
Average
Balance
Interest
Income/
Expense
Yield/
Rate
Average
Balance
Interest
Income/
Expense
Yield/
Rate
Earning assets
Time deposits placed and other short-term investments (1) $ 15,782 $ 48 1.21% $17,256 $471.07%
Federal funds sold and securities borrowed or purchased under agreements to resell 203,415 304 0.59 223,434 291 0.52
Trading account assets 156,194 1,182 3.01 144,502 1,093 3.01
Debt securities (2) 325,119 2,455 3.02 327,493 2,211 2.70
Loans and leases (3):
Residential mortgage (4) 253,974 2,374 3.74 256,297 2,359 3.68
Home equity 95,388 953 3.97 98,172 930 3.77
U.S. credit card 90,057 2,125 9.36 90,005 2,226 9.81
Non-U.S. credit card 11,171 310 11.01 10,633 317 11.81
Direct/Indirect consumer (5) 82,990 565 2.70 83,773 587 2.78
Other consumer (6) 1,929 17 3.73 1,867 19 3.89
Total consumer 535,509 6,344 4.72 540,747 6,438 4.74
U.S. commercial 225,596 1,700 2.99 221,542 1,704 3.05
Commercial real estate (7) 46,341 374 3.20 43,164 352 3.24
Commercial lease financing 24,468 206 3.37 23,869 204 3.41
Non-U.S. commercial 97,863 544 2.20 94,656 528 2.22
Total commercial 394,268 2,824 2.84 383,231 2,788 2.89
Total loans and leases 929,777 9,168 3.92 923,978 9,226 3.97
Other earning assets 78,214 709 3.61 74,022 677 3.62
Total earning assets (8) 1,708,501 13,866 3.23 1,710,685 13,545 3.15
Cash and cash equivalents (1) 125,259 59 113,064 50
Other assets, less allowance for loan and lease losses 301,115 299,681
Total assets $ 2,134,875 $2,123,430
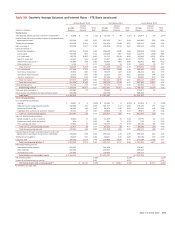
Interest-bearing liabilities
U.S. interest-bearing deposits:
Savings $ 43,665 $ 5 0.05% $43,968 $ 5 0.05%
NOW and money market deposit accounts 514,220 89 0.07 508,136 100 0.08
Consumer CDs and IRAs 77,424 97 0.50 81,190 116 0.56
Negotiable CDs, public funds and other deposits 26,271 28 0.40 24,079 25 0.42
Total U.S. interest-bearing deposits 661,580 219 0.13 657,373 246 0.15
Non-U.S. interest-bearing deposits:
Banks located in non-U.S. countries 13,878 18 0.52 12,789 16 0.47
Governments and official institutions 1,258 — 0.22 1,041 1 0.25
Time, savings and other 59,029 77 0.51 55,446 71 0.52
Total non-U.S. interest-bearing deposits 74,165 95 0.51 69,276 88 0.50
Total interest-bearing deposits 735,745 314 0.17 726,649 334 0.18
Federal funds purchased, securities loaned or sold under agreements to repurchase and short-term
borrowings 271,538 682 1.00 279,425 683 0.97
Trading account liabilities 82,393 364 1.75 84,648 375 1.76
Long-term debt 251,055 1,566 2.48 258,717 1,724 2.65
Total interest-bearing liabilities (8) 1,340,731 2,926 0.87 1,349,439 3,116 0.92
Noninterest-bearing sources:
Noninterest-bearing deposits 376,929 363,962
Other liabilities 183,800 179,637
Shareholders’ equity 233,415 230,392
Total liabilities and shareholders’ equity $ 2,134,875 $2,123,430
Net interest spread 2.36% 2.23%
Impact of noninterest-bearing sources 0.19 0.20
Net interest income/yield on earning assets (1) $ 10,940 2.55% $10,429 2.43%
(1) For this presentation, fees earned on overnight deposits placed with the Federal Reserve are included in the cash and cash equivalents line, consistent with the Consolidated Balance Sheet
presentation of these deposits. In addition, beginning in the third quarter of 2012, fees earned on deposits, primarily overnight, placed with certain non-U.S. central banks, which are included in the
time deposits placed and other short-term investments line in prior periods, are included in the cash and cash equivalents line. Net interest income and net interest yield are calculated excluding
the fees included in the cash and cash equivalents line.
(2) Yields on debt securities carried at fair value are calculated based on fair value rather than the cost basis. The use of fair value does not have a material impact on net interest yield.
(3) Nonperforming loans are included in the respective average loan balances. Income on these nonperforming loans is generally recognized on a cost recovery basis. PCI loans were recorded at fair
value upon acquisition and accrete interest income over the remaining life of the loan.
(4) Includes non-U.S. residential mortgage loans of $56 million, $83 million, $86 million and $90 million in the fourth, third, second and first quarters of 2013, respectively, and $93 million in the fourth
quarter of 2012.
(5) Includes non-U.S. consumer loans of $5.1 billion, $6.7 billion, $7.5 billion and $7.7 billion in the fourth, third, second and first quarters of 2013, respectively, and $8.1 billion in the fourth quarter
of 2012.
(6) Includes consumer finance loans of $1.2 billion, $1.3 billion, $1.3 billion and $1.4 billion in the fourth, third, second and first quarters of 2013, respectively, and $1.4 billion in the fourth quarter
of 2012; consumer leases of $549 million, $422 million, $291 million and $138 million in the fourth, third, second and first quarters of 2013, respectively, and $3 million in the fourth quarter of
2012; other non-U.S. consumer loans of $5 million for each of the quarters of 2013, and $4 million in the fourth quarter of 2012; and consumer overdrafts of $163 million, $172 million, $136
million and $142 million in the fourth, third, second and first quarters of 2013, respectively, and $156 million in the fourth quarter of 2012.
(7) Includes U.S. commercial real estate loans of $44.5 billion, $41.5 billion, $39.1 billion and $37.7 billion in the fourth, third, second and first quarters of 2013, respectively, and $36.7 billion in the
fourth quarter of 2012; and non-U.S. commercial real estate loans of $1.8 billion, $1.7 billion, $1.5 billion and $1.5 billion in the fourth, third, second and first quarters of 2013, respectively, and
$1.5 billion in the fourth quarter of 2012.
(8) Interest income includes the impact of interest rate risk management contracts, which decreased interest income on the underlying assets by $0, $1 million, $63 million and $141 million in the
fourth, third, second and first quarters of 2013, respectively, and $146 million in the fourth quarter of 2012. Interest expense includes the impact of interest rate risk management contracts, which
decreased interest expense on the underlying liabilities by $588 million, $556 million, $660 million and $618 million in the fourth, third, second and first quarters of 2013, respectively, and $598
million in the fourth quarter of 2012. For more information on interest rate contracts, see Interest Rate Risk Management for Nontrading Activities on page 109.