Bank of America 2013 Annual Report Download - page 150
Download and view the complete annual report
Please find page 150 of the 2013 Bank of America annual report below. You can navigate through the pages in the report by either clicking on the pages listed below, or by using the keyword search tool below to find specific information within the annual report.-
 1
1 -
2
-
3
-
4
-
5
-
6
-
7
-
8
-
9
-
10
-
11
-
12
-
13
-
14
-
15
-
16
-
17
-
18
-
19
-
20
-
21
-
22
-
23
-
24
-
25
-
26
-
27
-
28
-
29
-
30
-
31
-
32
-
33
-
34
-
35
-
36
-
37
-
38
-
39
-
40
-
41
-
42
-
43
-
44
-
45
-
46
-
47
-
48
-
49
-
50
-
51
-
52
-
53
-
54
-
55
-
56
-
57
-
58
-
59
-
60
-
61
-
62
-
63
-
64
-
65
-
66
-
67
-
68
-
69
-
70
-
71
-
72
-
73
-
74
-
75
-
76
-
77
-
78
-
79
-
80
-
81
-
82
-
83
-
84
-
85
-
86
-
87
-
88
-
89
-
90
-
91
-
92
-
93
-
94
-
95
-
96
-
97
-
98
-
99
-
100
-
101
-
102
-
103
-
104
-
105
-
106
-
107
-
108
-
109
-
110
-
111
-
112
-
113
-
114
-
115
-
116
-
117
-
118
-
119
-
120
-
121
-
122
-
123
-
124
-
125
-
126
-
127
-
128
-
129
-
130
-
131
-
132
-
133
-
134
-
135
-
136
-
137
-
138
-
139
-
 140
140 -
 141
141 -
 142
142 -
 143
143 -
 144
144 -
 145
145 -
 146
146 -
 147
147 -
 148
148 -
 149
149 -
 150
150 -
 151
151 -
 152
152 -
 153
153 -
 154
154 -
 155
155 -
 156
156 -
 157
157 -
 158
158 -
 159
159 -
 160
160 -
161
-
162
-
163
-
164
-
165
-
166
-
167
-
168
-
169
-
170
-
171
-
172
-
173
-
174
-
175
-
176
-
177
-
178
-
179
-
180
-
181
-
182
-
183
-
184
-
185
-
186
-
187
-
188
-
189
-
190
-
191
-
192
-
193
-
194
-
195
-
196
-
197
-
198
-
199
-
200
-
201
-
202
-
203
-
204
-
205
-
206
-
207
-
208
-
209
-
210
-
211
-
212
-
213
-
214
-
215
-
216
-
217
-
218
-
219
-
220
-
221
-
222
-
223
-
224
-
225
-
226
-
227
-
228
-
229
-
230
-
231
-
232
-
233
-
234
-
235
-
236
-
237
-
238
-
239
-
240
-
241
-
242
-
243
-
244
-
245
-
246
-
247
-
248
-
249
-
250
-
251
-
252
-
253
-
254
-
255
-
256
-
257
-
258
-
259
-
260
-
261
-
262
-
263
-
264
-
265
-
266
-
267
-
268
-
269
-
270
-
271
-
272
-
273
-
274
-
275
-
276
-
277
-
278
-
279
-
280
-
281
-
282
-
283
-
284
 |
 |

148 Bank of America 2013
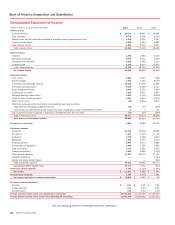
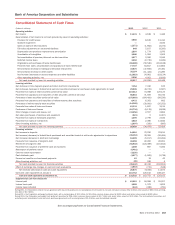
Bank of America Corporation and Subsidiaries
Consolidated Statement of Income
(Dollars in millions, except per share information) 2013 2012 2011
Interest income
Loans and leases $ 36,470 $ 38,880 $ 44,966
Debt securities 9,749 8,908 9,525
Federal funds sold and securities borrowed or purchased under agreements to resell 1,229 1,502 2,147
Trading account assets 4,706 5,094 5,961
Other interest income 2,866 3,016 3,637
Total interest income 55,020 57,400 66,236
Interest expense
Deposits 1,396 1,990 3,002
Short-term borrowings 2,923 3,572 4,599
Trading account liabilities 1,638 1,763 2,212
Long-term debt 6,798 9,419 11,807
Total interest expense 12,755 16,744 21,620
Net interest income 42,265 40,656 44,616
Noninterest income
Card income 5,826 6,121 7,184
Service charges 7,390 7,600 8,094
Investment and brokerage services 12,282 11,393 11,826
Investment banking income 6,126 5,299 5,217
Equity investment income 2,901 2,070 7,360
Trading account profits 7,056 5,870 6,697
Mortgage banking income (loss) 3,874 4,750 (8,830)
Gains on sales of debt securities 1,271 1,662 3,374
Other income (loss) (29) (2,034) 8,215
Other-than-temporary impairment losses on available-for-sale debt securities:
Total other-than-temporary impairment losses (21) (57) (360)
Less: Portion of other-than-temporary impairment losses recognized in other comprehensive income 1461
Net impairment losses recognized in earnings on available-for-sale debt securities (20) (53) (299)
Total noninterest income 46,677 42,678 48,838
Total revenue, net of interest expense 88,942 83,334 93,454
Provision for credit losses 3,556 8,169 13,410
Noninterest expense
Personnel 34,719 35,648 36,965
Occupancy 4,475 4,570 4,748
Equipment 2,146 2,269 2,340
Marketing 1,834 1,873 2,203
Professional fees 2,884 3,574 3,381
Amortization of intangibles 1,086 1,264 1,509
Data processing 3,170 2,961 2,652
Telecommunications 1,593 1,660 1,553
Other general operating 17,307 18,274 21,101
Goodwill impairment —— 3,184
Merger and restructuring charges —— 638
Total noninterest expense 69,214 72,093 80,274
Income (loss) before income taxes 16,172 3,072 (230)
Income tax expense (benefit) 4,741 (1,116) (1,676)
Net income $ 11,431 $ 4,188 $ 1,446
Preferred stock dividends 1,349 1,428 1,361
Net income applicable to common shareholders $ 10,082 $ 2,760 $ 85
Per common share information
Earnings $0.94 $ 0.26 $ 0.01
Diluted earnings 0.90 0.25 0.01
Dividends paid 0.04 0.04 0.04
Average common shares issued and outstanding (in thousands) 10,731,165 10,746,028 10,142,625
Average diluted common shares issued and outstanding (in thousands) 11,491,418 10,840,854 10,254,824
See accompanying Notes to Consolidated Financial Statements.