Bank of America 2013 Annual Report Download - page 278
Download and view the complete annual report
Please find page 278 of the 2013 Bank of America annual report below. You can navigate through the pages in the report by either clicking on the pages listed below, or by using the keyword search tool below to find specific information within the annual report.-
 1
1 -
2
-
3
-
4
-
5
-
6
-
7
-
8
-
9
-
10
-
11
-
12
-
13
-
14
-
15
-
16
-
17
-
18
-
19
-
20
-
21
-
22
-
23
-
24
-
25
-
26
-
27
-
28
-
29
-
30
-
31
-
32
-
33
-
34
-
35
-
36
-
37
-
38
-
39
-
40
-
41
-
42
-
43
-
44
-
45
-
46
-
47
-
48
-
49
-
50
-
51
-
52
-
53
-
54
-
55
-
56
-
57
-
58
-
59
-
60
-
61
-
62
-
63
-
64
-
65
-
66
-
67
-
68
-
69
-
70
-
71
-
72
-
73
-
74
-
75
-
76
-
77
-
78
-
79
-
80
-
81
-
82
-
83
-
84
-
85
-
86
-
87
-
88
-
89
-
90
-
91
-
92
-
93
-
94
-
95
-
96
-
97
-
98
-
99
-
100
-
101
-
102
-
103
-
104
-
105
-
106
-
107
-
108
-
109
-
110
-
111
-
112
-
113
-
114
-
115
-
116
-
117
-
118
-
119
-
120
-
121
-
122
-
123
-
124
-
125
-
126
-
127
-
128
-
129
-
130
-
131
-
132
-
133
-
134
-
135
-
136
-
137
-
138
-
139
-
140
-
141
-
142
-
143
-
144
-
145
-
146
-
147
-
148
-
149
-
150
-
151
-
152
-
153
-
154
-
155
-
156
-
157
-
158
-
159
-
160
-
161
-
162
-
163
-
164
-
165
-
166
-
167
-
168
-
169
-
170
-
171
-
172
-
173
-
174
-
175
-
176
-
177
-
178
-
179
-
180
-
181
-
182
-
183
-
184
-
185
-
186
-
187
-
188
-
189
-
190
-
191
-
192
-
193
-
194
-
195
-
196
-
197
-
198
-
199
-
200
-
201
-
202
-
203
-
204
-
205
-
206
-
207
-
208
-
209
-
210
-
211
-
212
-
213
-
214
-
215
-
216
-
217
-
218
-
219
-
220
-
221
-
222
-
223
-
224
-
225
-
226
-
227
-
228
-
229
-
230
-
231
-
232
-
233
-
234
-
235
-
236
-
237
-
238
-
239
-
240
-
241
-
242
-
243
-
244
-
245
-
246
-
247
-
248
-
249
-
250
-
251
-
252
-
253
-
254
-
255
-
256
-
257
-
258
-
259
-
260
-
261
-
262
-
263
-
264
-
265
-
266
-
267
-
 268
268 -
 269
269 -
 270
270 -
 271
271 -
 272
272 -
 273
273 -
 274
274 -
 275
275 -
 276
276 -
 277
277 -
 278
278 -
 279
279 -
 280
280 -
 281
281 -
 282
282 -
 283
283 -
 284
284
 |
 |

276 Bank of America 2013
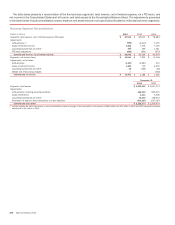
Condensed Statement of Cash Flows
(Dollars in millions) 2013 2012 2011
Operating activities
Net income $ 11,431 $ 4,188 $ 1,446
Reconciliation of net income to net cash provided by (used in) operating activities:
Equity in undistributed (earnings) losses of subsidiaries (12,042) 1,754 5,544
Other operating activities, net (10,422) (3,432) 6,716
Net cash provided by (used in) operating activities (11,033) 2,510 13,706
Investing activities
Net sales of securities 459 13 8,444
Net payments from subsidiaries 39,336 12,973 5,780
Other investing activities, net 3445 (8)
Net cash provided by investing activities 39,798 13,431 14,216
Financing activities
Net increase (decrease) in short-term borrowings 178 (616) (13,172)
Net increase (decrease) in other advances (14,378) 10,100 (4,449)
Proceeds from issuance of long-term debt 30,966 17,176 16,047
Retirement of long-term debt (39,320) (63,851) (21,742)
Proceeds from issuance of preferred stock and warrants 1,008 667 5,000
Redemption of preferred stock (6,461)— —
Common stock repurchased (3,220)— —
Cash dividends paid (1,677)(1,909) (1,738)
Other financing activities, net —(668) (1)
Net cash used in financing activities (32,904) (39,101) (20,055)
Net increase (decrease) in cash held at bank subsidiaries (4,139)(23,160) 7,867
Cash held at bank subsidiaries at January 1 102,818 124,991 117,124
Cash held at bank subsidiaries at December 31 $ 98,679 $101,831 $ 124,991
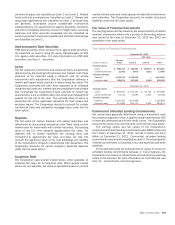
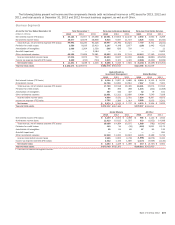
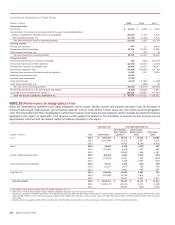
NOTE 26 Performance by Geographical Area
Since the Corporation’s operations are highly integrated, certain asset, liability, income and expense amounts must be allocated to
arrive at total assets, total revenue, net of interest expense, income (loss) before income taxes and net income (loss) by geographic
area. The Corporation identifies its geographic performance based on the business unit structure used to manage the capital or expense
deployed in the region as applicable. This requires certain judgments related to the allocation of revenue so that revenue can be
appropriately matched with the related capital or expense deployed in the region.
December 31 Year Ended December 31
(Dollars in millions) Year Total Assets
(1)
Total Revenue,
Net of Interest
Expense (2)
Income (Loss)
Before Income
Taxes
Net Income
(Loss)
U.S. (3) 2013 $ 1,803,243 $ 76,612 $ 13,221 $ 10,588
2012 1,902,946 72,175 1,867 4,116
2011 73,613 (9,261) (3,471)
Asia (4) 2013 98,605 4,442 1,382 887
2012 102,492 3,478 353 282
2011 10,890 7,598 4,787
Europe, Middle East and Africa 2013 169,708 6,353 1,003 (403)
2012 171,209 6,011 323 (543)
2011 7,320 1,009 (137)
Latin America and the Caribbean 2013 30,717 1,535 566 359
2012 33,327 1,670 529 333
2011 1,631 424 267
Total Non-U.S. 2013 299,030 12,330 2,951 843
2012 307,028 11,159 1,205 72
2011 19,841 9,031 4,917
Total Consolidated 2013 $ 2,102,273 $ 88,942 $ 16,172 $ 11,431
2012 2,209,974 83,334 3,072 4,188
2011 93,454 (230) 1,446
(1) Total assets include long-lived assets, which are primarily located in the U.S.
(2) There were no material intercompany revenues between geographic regions for any of the periods presented.
(3) Includes the Corporation’s Canadian operations, which had total assets of $9.6 billion and $8.3 billion at December 31, 2013 and 2012; total revenue, net of interest expense of $364 million, $317
million and $1.3 billion; income before income taxes of $258 million, $202 million and $621 million; and net income of $199 million, $141 million and $528 million for 2013, 2012 and 2011,
respectively.
(4) Amounts include pre-tax gains of $753 million and $6.5 billion ($474 million and $4.1 billion net-of-tax) on the sale of common shares of CCB during 2013 and 2011.