Bank of America 2013 Annual Report Download - page 130
Download and view the complete annual report
Please find page 130 of the 2013 Bank of America annual report below. You can navigate through the pages in the report by either clicking on the pages listed below, or by using the keyword search tool below to find specific information within the annual report.-
 1
1 -
2
-
3
-
4
-
5
-
6
-
7
-
8
-
9
-
10
-
11
-
12
-
13
-
14
-
15
-
16
-
17
-
18
-
19
-
20
-
21
-
22
-
23
-
24
-
25
-
26
-
27
-
28
-
29
-
30
-
31
-
32
-
33
-
34
-
35
-
36
-
37
-
38
-
39
-
40
-
41
-
42
-
43
-
44
-
45
-
46
-
47
-
48
-
49
-
50
-
51
-
52
-
53
-
54
-
55
-
56
-
57
-
58
-
59
-
60
-
61
-
62
-
63
-
64
-
65
-
66
-
67
-
68
-
69
-
70
-
71
-
72
-
73
-
74
-
75
-
76
-
77
-
78
-
79
-
80
-
81
-
82
-
83
-
84
-
85
-
86
-
87
-
88
-
89
-
90
-
91
-
92
-
93
-
94
-
95
-
96
-
97
-
98
-
99
-
100
-
101
-
102
-
103
-
104
-
105
-
106
-
107
-
108
-
109
-
110
-
111
-
112
-
113
-
114
-
115
-
116
-
117
-
118
-
119
-
 120
120 -
 121
121 -
 122
122 -
 123
123 -
 124
124 -
 125
125 -
 126
126 -
 127
127 -
 128
128 -
 129
129 -
 130
130 -
 131
131 -
 132
132 -
 133
133 -
 134
134 -
 135
135 -
 136
136 -
 137
137 -
 138
138 -
 139
139 -
 140
140 -
141
-
142
-
143
-
144
-
145
-
146
-
147
-
148
-
149
-
150
-
151
-
152
-
153
-
154
-
155
-
156
-
157
-
158
-
159
-
160
-
161
-
162
-
163
-
164
-
165
-
166
-
167
-
168
-
169
-
170
-
171
-
172
-
173
-
174
-
175
-
176
-
177
-
178
-
179
-
180
-
181
-
182
-
183
-
184
-
185
-
186
-
187
-
188
-
189
-
190
-
191
-
192
-
193
-
194
-
195
-
196
-
197
-
198
-
199
-
200
-
201
-
202
-
203
-
204
-
205
-
206
-
207
-
208
-
209
-
210
-
211
-
212
-
213
-
214
-
215
-
216
-
217
-
218
-
219
-
220
-
221
-
222
-
223
-
224
-
225
-
226
-
227
-
228
-
229
-
230
-
231
-
232
-
233
-
234
-
235
-
236
-
237
-
238
-
239
-
240
-
241
-
242
-
243
-
244
-
245
-
246
-
247
-
248
-
249
-
250
-
251
-
252
-
253
-
254
-
255
-
256
-
257
-
258
-
259
-
260
-
261
-
262
-
263
-
264
-
265
-
266
-
267
-
268
-
269
-
270
-
271
-
272
-
273
-
274
-
275
-
276
-
277
-
278
-
279
-
280
-
281
-
282
-
283
-
284
 |
 |

128 Bank of America 2013
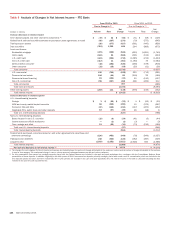
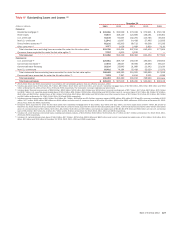
Table V Nonperforming Loans, Leases and Foreclosed Properties (1)
December 31
(Dollars in millions) 2013 2012 2011 2010 2009
Consumer
Residential mortgage $ 11,712 $ 15,055 $ 16,259 $ 18,020 $ 16,841
Home equity 4,075 4,282 2,454 2,696 3,808
Direct/Indirect consumer 35 92 40 90 86
Other consumer 18 21548104
Total consumer (2) 15,840 19,431 18,768 20,854 20,839
Commercial
U.S. commercial 819 1,484 2,174 3,453 4,925
Commercial real estate 322 1,513 3,880 5,829 7,286
Commercial lease financing 16 44 26 117 115
Non-U.S. commercial 64 68 143 233 177
1,221 3,109 6,223 9,632 12,503
U.S. small business commercial 88 115 114 204 200
Total commercial (3) 1,309 3,224 6,337 9,836 12,703
Total nonperforming loans and leases 17,149 22,655 25,105 30,690 33,542
Foreclosed properties 623 900 2,603 1,974 2,205
Total nonperforming loans, leases and foreclosed properties $ 17,772 $ 23,555 $ 27,708 $ 32,664 $ 35,747
(1) Balances do not include PCI loans even though the customer may be contractually past due. PCI loans were recorded at fair value upon acquisition and accrete interest income over the remaining
life of the loan. In addition, balances do not include foreclosed properties that are insured by the FHA and have entered foreclosure of $1.4 billion, $2.5 billion and $1.4 billion at December 31,
2013, 2012 and 2011, respectively.
(2) In 2013, $2.3 billion in interest income was estimated to be contractually due on consumer loans and leases classified as nonperforming and TDRs classified as performing, if these loans and
leases had been paying according to their terms and conditions. At December 31, 2013, the TDRs classified as performing of $22.5 billion are not included in the table above. Approximately $1.4
billion of the estimated $2.3 billion in contractual interest was received and included in interest income for 2013.
(3) In 2013, $157 million in interest income was estimated to be contractually due on commercial loans and leases classified as nonperforming and TDRs classified as performing, if these loans and
leases had been paying according to their terms and conditions. At December 31, 2013, the TDRs classified as performing of $1.8 billion are not included in the table above. Approximately $75
million of the estimated $157 million in contractual interest was received and included in interest income for 2013.