Bank of America 2012 Annual Report Download - page 100
Download and view the complete annual report
Please find page 100 of the 2012 Bank of America annual report below. You can navigate through the pages in the report by either clicking on the pages listed below, or by using the keyword search tool below to find specific information within the annual report.-
 1
1 -
2
-
3
-
4
-
5
-
6
-
7
-
8
-
9
-
10
-
11
-
12
-
13
-
14
-
15
-
16
-
17
-
18
-
19
-
20
-
21
-
22
-
23
-
24
-
25
-
26
-
27
-
28
-
29
-
30
-
31
-
32
-
33
-
34
-
35
-
36
-
37
-
38
-
39
-
40
-
41
-
42
-
43
-
44
-
45
-
46
-
47
-
48
-
49
-
50
-
51
-
52
-
53
-
54
-
55
-
56
-
57
-
58
-
59
-
60
-
61
-
62
-
63
-
64
-
65
-
66
-
67
-
68
-
69
-
70
-
71
-
72
-
73
-
74
-
75
-
76
-
77
-
78
-
79
-
80
-
81
-
82
-
83
-
84
-
85
-
86
-
87
-
88
-
89
-
 90
90 -
 91
91 -
 92
92 -
 93
93 -
 94
94 -
 95
95 -
 96
96 -
 97
97 -
 98
98 -
 99
99 -
 100
100 -
 101
101 -
 102
102 -
 103
103 -
 104
104 -
 105
105 -
 106
106 -
 107
107 -
 108
108 -
 109
109 -
 110
110 -
111
-
112
-
113
-
114
-
115
-
116
-
117
-
118
-
119
-
120
-
121
-
122
-
123
-
124
-
125
-
126
-
127
-
128
-
129
-
130
-
131
-
132
-
133
-
134
-
135
-
136
-
137
-
138
-
139
-
140
-
141
-
142
-
143
-
144
-
145
-
146
-
147
-
148
-
149
-
150
-
151
-
152
-
153
-
154
-
155
-
156
-
157
-
158
-
159
-
160
-
161
-
162
-
163
-
164
-
165
-
166
-
167
-
168
-
169
-
170
-
171
-
172
-
173
-
174
-
175
-
176
-
177
-
178
-
179
-
180
-
181
-
182
-
183
-
184
-
185
-
186
-
187
-
188
-
189
-
190
-
191
-
192
-
193
-
194
-
195
-
196
-
197
-
198
-
199
-
200
-
201
-
202
-
203
-
204
-
205
-
206
-
207
-
208
-
209
-
210
-
211
-
212
-
213
-
214
-
215
-
216
-
217
-
218
-
219
-
220
-
221
-
222
-
223
-
224
-
225
-
226
-
227
-
228
-
229
-
230
-
231
-
232
-
233
-
234
-
235
-
236
-
237
-
238
-
239
-
240
-
241
-
242
-
243
-
244
-
245
-
246
-
247
-
248
-
249
-
250
-
251
-
252
-
253
-
254
-
255
-
256
-
257
-
258
-
259
-
260
-
261
-
262
-
263
-
264
-
265
-
266
-
267
-
268
-
269
-
270
-
271
-
272
-
273
-
274
-
275
-
276
-
277
-
278
-
279
-
280
-
281
-
282
-
283
-
284
 |
 |
98 Bank of America 2012
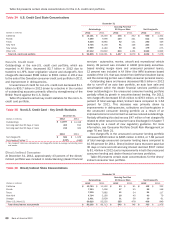
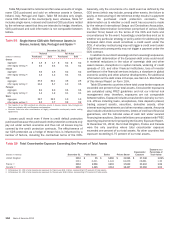
Industry Concentrations
Table 48 presents commercial committed and utilized credit
exposure by industry and the total net credit default protection
purchased to cover the funded and unfunded portions of certain
credit exposures. Our commercial credit exposure is diversified
across a broad range of industries. Total committed commercial
credit exposure increased $16.5 billion, or two percent, to $767.0
billion at December 31, 2012. The increase in commercial
committed exposure was concentrated in food, beverage and
tobacco, banking, energy, diversified financials, and real estate,
partially offset by lower exposure to government and public
education.
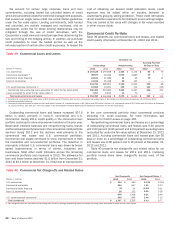
Industry limits are used internally to manage industry
concentrations and are based on committed exposures and capital
usage that are allocated on an industry-by-industry basis. A risk
management framework is in place to set and approve industry
limits as well as to provide ongoing monitoring. Management’s
Credit Risk Committee (CRC) oversees industry limit governance.
Diversified financials, our largest industry concentration,
experienced an increase in committed exposure of $4.7 billion, or
five percent, in 2012 primarily driven by increases in margin loans
and certain asset-backed lending products, partially offset by a
decrease in derivative exposure.
Real estate, our second largest industry concentration,
experienced an increase in committed exposure of $3.1 billion, or
five percent, in 2012 primarily due to new originations and renewals
outpacing paydowns and sales. Real estate construction and land
development exposure represented 14 percent of the total real
estate industry committed exposure at December 31, 2012, down
from 20 percent at December 31, 2011. For more information on
commercial real estate and related portfolios, see Commercial
Real Estate on page 94.
Committed exposure in the food, beverage and tobacco
industry increased $6.8 billion, or 22 percent, in 2012 primarily
related to short-term acquisition financing. Government and public
education committed exposure decreased $6.7 billion, or 12
percent, in 2012 primarily driven by decreases in loans and SBLCs.
Banking committed exposure increased $6.5 billion, or 17 percent,
in 2012 primarily driven by loans to mortgage finance companies
and trade finance activity with non-U.S. banks. Energy committed
exposure increased $6.4 billion, or 20 percent, in 2012 reflecting
loan growth in the exploration and production, and integrated oil
sectors.
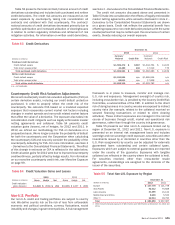
Our committed state and municipal exposure of $38.0 billion
at December 31, 2012 consisted of $30.9 billion of commercial
utilized exposure (including $17.6 billion of funded loans, $8.9
billion of SBLCs and $3.6 billion of derivative assets) and unfunded
commercial exposure of $7.2 billion (primarily unfunded loan
commitments and letters of credit) and is reported in the
government and public education industry in Table 48. While the
slow economic recovery continues to pressure budgets, most U.S.
state and local governments have implemented offsetting fiscal
adjustments and continue to honor debt obligations as agreed.
While historical default rates have been low, as part of our overall
and ongoing risk management processes, we continually monitor
these exposures through a rigorous review process. Additionally,
internal communications are regularly circulated to maintain
exposure levels and are in compliance with established
concentration guidelines.