Bank of America 2012 Annual Report Download - page 128
Download and view the complete annual report
Please find page 128 of the 2012 Bank of America annual report below. You can navigate through the pages in the report by either clicking on the pages listed below, or by using the keyword search tool below to find specific information within the annual report.-
 1
1 -
2
-
3
-
4
-
5
-
6
-
7
-
8
-
9
-
10
-
11
-
12
-
13
-
14
-
15
-
16
-
17
-
18
-
19
-
20
-
21
-
22
-
23
-
24
-
25
-
26
-
27
-
28
-
29
-
30
-
31
-
32
-
33
-
34
-
35
-
36
-
37
-
38
-
39
-
40
-
41
-
42
-
43
-
44
-
45
-
46
-
47
-
48
-
49
-
50
-
51
-
52
-
53
-
54
-
55
-
56
-
57
-
58
-
59
-
60
-
61
-
62
-
63
-
64
-
65
-
66
-
67
-
68
-
69
-
70
-
71
-
72
-
73
-
74
-
75
-
76
-
77
-
78
-
79
-
80
-
81
-
82
-
83
-
84
-
85
-
86
-
87
-
88
-
89
-
90
-
91
-
92
-
93
-
94
-
95
-
96
-
97
-
98
-
99
-
100
-
101
-
102
-
103
-
104
-
105
-
106
-
107
-
108
-
109
-
110
-
111
-
112
-
113
-
114
-
115
-
116
-
117
-
 118
118 -
 119
119 -
 120
120 -
 121
121 -
 122
122 -
 123
123 -
 124
124 -
 125
125 -
 126
126 -
 127
127 -
 128
128 -
 129
129 -
 130
130 -
 131
131 -
 132
132 -
 133
133 -
 134
134 -
 135
135 -
 136
136 -
 137
137 -
 138
138 -
139
-
140
-
141
-
142
-
143
-
144
-
145
-
146
-
147
-
148
-
149
-
150
-
151
-
152
-
153
-
154
-
155
-
156
-
157
-
158
-
159
-
160
-
161
-
162
-
163
-
164
-
165
-
166
-
167
-
168
-
169
-
170
-
171
-
172
-
173
-
174
-
175
-
176
-
177
-
178
-
179
-
180
-
181
-
182
-
183
-
184
-
185
-
186
-
187
-
188
-
189
-
190
-
191
-
192
-
193
-
194
-
195
-
196
-
197
-
198
-
199
-
200
-
201
-
202
-
203
-
204
-
205
-
206
-
207
-
208
-
209
-
210
-
211
-
212
-
213
-
214
-
215
-
216
-
217
-
218
-
219
-
220
-
221
-
222
-
223
-
224
-
225
-
226
-
227
-
228
-
229
-
230
-
231
-
232
-
233
-
234
-
235
-
236
-
237
-
238
-
239
-
240
-
241
-
242
-
243
-
244
-
245
-
246
-
247
-
248
-
249
-
250
-
251
-
252
-
253
-
254
-
255
-
256
-
257
-
258
-
259
-
260
-
261
-
262
-
263
-
264
-
265
-
266
-
267
-
268
-
269
-
270
-
271
-
272
-
273
-
274
-
275
-
276
-
277
-
278
-
279
-
280
-
281
-
282
-
283
-
284
 |
 |

126 Bank of America 2012
Statistical Tables
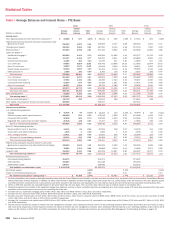
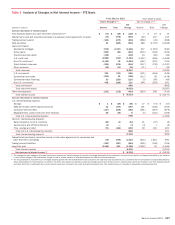
Table I Average Balances and Interest Rates – FTE Basis
2012 2011 2010
(Dollars in millions)
Average
Balance
Interest
Income/
Expense
Yield/
Rate
Average
Balance
Interest
Income/
Expense
Yield/
Rate
Average
Balance
Interest
Income/
Expense
Yield/
Rate
Earning assets
Time deposits placed and other short-term investments (1) $ 22,888 $ 237 1.03% $ 28,242 $ 366 1.29% $ 27,419 $292 1.06%
Federal funds sold and securities borrowed or purchased under
agreements to resell 236,042 1,502 0.64 245,069 2,147 0.88 256,943 1,832 0.71
Trading account assets 182,359 5,306 2.91 187,340 6,142 3.28 213,745 7,050 3.30
Debt securities (2) 337,653 8,798 2.61 337,120 9,602 2.85 323,946 11,850 3.66
Loans and leases (3):
Residential mortgage (4) 253,050 9,470 3.74 265,546 11,096 4.18 245,727 11,736 4.78
Home equity 117,197 4,418 3.77 130,781 5,041 3.85 145,860 5,990 4.11
Discontinued real estate 11,256 383 3.40 14,730 501 3.40 13,830 527 3.81
U.S. credit card 94,863 9,504 10.02 105,478 10,808 10.25 117,962 12,644 10.72
Non-U.S. credit card 13,549 1,572 11.60 24,049 2,656 11.04 28,011 3,450 12.32
Direct/Indirect consumer (5) 84,424 2,900 3.44 90,163 3,716 4.12 96,649 4,753 4.92
Other consumer (6) 2,359 140 5.95 2,760 176 6.39 2,927 186 6.34
Total consumer 576,698 28,387 4.92 633,507 33,994 5.37 650,966 39,286 6.04
U.S. commercial 201,352 6,979 3.47 192,524 7,360 3.82 195,895 7,909 4.04
Commercial real estate (7) 37,982 1,332 3.51 44,406 1,522 3.43 59,947 2,000 3.34
Commercial lease financing 21,879 874 4.00 21,383 1,001 4.68 21,427 1,070 4.99
Non-U.S. commercial 60,857 1,594 2.62 46,276 1,382 2.99 30,096 1,091 3.62
Total commercial 322,070 10,779 3.35 304,589 11,265 3.70 307,365 12,070 3.93
Total loans and leases 898,768 39,166 4.36 938,096 45,259 4.82 958,331 51,356 5.36
Other earning assets 92,259 3,103 3.36 98,792 3,506 3.55 117,189 3,919 3.34
Total earning assets (8) 1,769,969 58,112 3.28 1,834,659 67,022 3.65 1,897,573 76,299 4.02
Cash and cash equivalents (1) 115,739 189 112,616 186 174,621 368
Other assets, less allowance for loan and lease losses 305,648
349,047 367,412
Total assets $ 2,191,356 $2,296,322 $ 2,439,606
Interest-bearing liabilities
U.S. interest-bearing deposits:
Savings $ 41,453 $ 45 0.11% $ 40,364 $ 100 0.25% $ 36,649 $157 0.43%
NOW and money market deposit accounts 466,096 693 0.15 470,519 1,060 0.23 441,589 1,405 0.32
Consumer CDs and IRAs 95,559 693 0.73 110,922 1,045 0.94 142,648 1,723 1.21
Negotiable CDs, public funds and other deposits 20,928 128 0.61 17,227 120 0.70 17,683 226 1.28
Total U.S. interest-bearing deposits 624,036 1,559 0.25 639,032 2,325 0.36 638,569 3,511 0.55
Non-U.S. interest-bearing deposits:
Banks located in non-U.S. countries 14,644 94 0.64 20,563 138 0.67 18,102 144 0.80
Governments and official institutions 1,019 4 0.35 1,985 7 0.35 3,349 10 0.28
Time, savings and other 53,411 333 0.62 61,851 532 0.86 55,059 332 0.60
Total non-U.S. interest-bearing deposits 69,074 431 0.62 84,399 677 0.80 76,510 486 0.64
Total interest-bearing deposits 693,110 1,990 0.29 723,431 3,002 0.42 715,079 3,997 0.56
Federal funds purchased, securities loaned or sold under
agreements to repurchase and other short-term borrowings 318,400 3,572 1.12 324,269 4,599 1.42 430,329 3,699 0.86
Trading account liabilities 78,554 1,763 2.24 84,689 2,212 2.61 91,669 2,571 2.80
Long-term debt 316,393 9,419 2.98 421,229 11,807 2.80 490,497 13,707 2.79
Total interest-bearing liabilities (8) 1,406,457 16,744 1.19 1,553,618 21,620 1.39 1,727,574 23,974 1.39
Noninterest-bearing sources:
Noninterest-bearing deposits 354,672
312,371 273,507
Other liabilities 194,550
201,238 205,290
Shareholders’ equity 235,677
229,095 233,235
Total liabilities and shareholders’ equity $ 2,191,356 $2,296,322 $ 2,439,606
Net interest spread 2.09% 2.26% 2.63%
Impact of noninterest-bearing sources 0.25 0.21 0.13
Net interest income/yield on earning assets (1) $ 41,368 2.34% $ 45,402 2.47% $ 52,325 2.76%
(1) For this presentation, fees earned on overnight deposits placed with the Federal Reserve are included in the cash and cash equivalents line, consistent with the Corporation’s Consolidated Balance
Sheet presentation of these deposits. In addition, for 2012, fees earned on deposits, primarily overnight, placed with certain non-U.S. central banks, which are included in the time deposits placed
and other short-term investments line in prior periods, have been included in the cash and cash equivalents line. Net interest income and net interest yield are calculated excluding these fees.
(2) Yields on AFS debt securities are calculated based on fair value rather than the cost basis. The use of fair value does not have a material impact on net interest yield.
(3) Nonperforming loans are included in the respective average loan balances. Income on these nonperforming loans is recognized on a cost recovery basis. PCI loans were recorded at fair value upon
acquisition and accrete interest income over the remaining life of the loan.
(4) Includes non-U.S. residential mortgage loans of $90 million, $91 million and $410 million in 2012, 2011 and 2010, respectively.
(5) Includes non-U.S. consumer loans of $7.8 billion, $8.5 billion and $7.9 billion in 2012, 2011 and 2010, respectively.
(6) Includes consumer finance loans of $1.5 billion, $1.8 billion and $2.1 billion; other non-U.S. consumer loans of $699 million, $878 million and $731 million; and consumer overdrafts of $128
million, $93 million and $111 million in 2012, 2011 and 2010, respectively.
(7) Includes U.S. commercial real estate loans of $36.4 billion, $42.1 billion and $57.3 billion; and non-U.S. commercial real estate loans of $1.6 billion, $2.3 billion and $2.7 billion in 2012, 2011
and 2010, respectively.
(8) Interest income includes the impact of interest rate risk management contracts, which decreased interest income on the underlying assets by $754 million, $2.6 billion and $1.4 billion in 2012,
2011 and 2010, respectively. Interest expense includes the impact of interest rate risk management contracts, which decreased interest expense on the underlying liabilities by $2.3 billion, $2.6
billion and $3.5 billion in 2012, 2011 and 2010, respectively. For further information on interest rate contracts, see Interest Rate Risk Management for Nontrading Activities on page 113.