Bank of America 2012 Annual Report Download - page 180
Download and view the complete annual report
Please find page 180 of the 2012 Bank of America annual report below. You can navigate through the pages in the report by either clicking on the pages listed below, or by using the keyword search tool below to find specific information within the annual report.-
 1
1 -
2
-
3
-
4
-
5
-
6
-
7
-
8
-
9
-
10
-
11
-
12
-
13
-
14
-
15
-
16
-
17
-
18
-
19
-
20
-
21
-
22
-
23
-
24
-
25
-
26
-
27
-
28
-
29
-
30
-
31
-
32
-
33
-
34
-
35
-
36
-
37
-
38
-
39
-
40
-
41
-
42
-
43
-
44
-
45
-
46
-
47
-
48
-
49
-
50
-
51
-
52
-
53
-
54
-
55
-
56
-
57
-
58
-
59
-
60
-
61
-
62
-
63
-
64
-
65
-
66
-
67
-
68
-
69
-
70
-
71
-
72
-
73
-
74
-
75
-
76
-
77
-
78
-
79
-
80
-
81
-
82
-
83
-
84
-
85
-
86
-
87
-
88
-
89
-
90
-
91
-
92
-
93
-
94
-
95
-
96
-
97
-
98
-
99
-
100
-
101
-
102
-
103
-
104
-
105
-
106
-
107
-
108
-
109
-
110
-
111
-
112
-
113
-
114
-
115
-
116
-
117
-
118
-
119
-
120
-
121
-
122
-
123
-
124
-
125
-
126
-
127
-
128
-
129
-
130
-
131
-
132
-
133
-
134
-
135
-
136
-
137
-
138
-
139
-
140
-
141
-
142
-
143
-
144
-
145
-
146
-
147
-
148
-
149
-
150
-
151
-
152
-
153
-
154
-
155
-
156
-
157
-
158
-
159
-
160
-
161
-
162
-
163
-
164
-
165
-
166
-
167
-
168
-
169
-
 170
170 -
 171
171 -
 172
172 -
 173
173 -
 174
174 -
 175
175 -
 176
176 -
 177
177 -
 178
178 -
 179
179 -
 180
180 -
 181
181 -
 182
182 -
 183
183 -
 184
184 -
 185
185 -
 186
186 -
 187
187 -
 188
188 -
 189
189 -
 190
190 -
191
-
192
-
193
-
194
-
195
-
196
-
197
-
198
-
199
-
200
-
201
-
202
-
203
-
204
-
205
-
206
-
207
-
208
-
209
-
210
-
211
-
212
-
213
-
214
-
215
-
216
-
217
-
218
-
219
-
220
-
221
-
222
-
223
-
224
-
225
-
226
-
227
-
228
-
229
-
230
-
231
-
232
-
233
-
234
-
235
-
236
-
237
-
238
-
239
-
240
-
241
-
242
-
243
-
244
-
245
-
246
-
247
-
248
-
249
-
250
-
251
-
252
-
253
-
254
-
255
-
256
-
257
-
258
-
259
-
260
-
261
-
262
-
263
-
264
-
265
-
266
-
267
-
268
-
269
-
270
-
271
-
272
-
273
-
274
-
275
-
276
-
277
-
278
-
279
-
280
-
281
-
282
-
283
-
284
 |
 |

178 Bank of America 2012
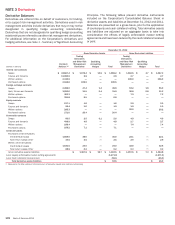
interest rate and currency changes that affect the expected
exposure, and other factors like changes in collateral
arrangements and partial payments. Credit spread changes and
non-credit factors can move independently. For example, for an
interest rate swap, changes in interest rates may increase the
expected exposure which would increase the counterparty credit
valuation adjustment (CVA). Independently, counterparty credit
spreads may tighten, which would result in an offsetting decrease
to CVA.
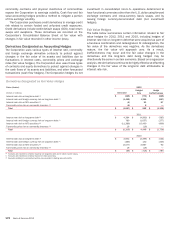
The Corporation may enter into risk management activities to
offset market driven exposures. The Corporation often hedges the
counterparty spread risk in CVA with CDS and often hedges the
other market risks in both CVA and debit valuation adjustments
(DVA) primarily with currency and interest rate swaps. Since the
components of the valuation adjustments on derivatives move
independently and the Corporation may not hedge all of the market
driven exposures, the effect of a hedge may increase the gross
valuation adjustments on derivatives or may result in a gross
positive valuation adjustment on derivatives becoming a negative
adjustment (or the reverse).
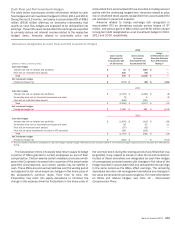
During 2012, the Corporation refined its methodology for
calculating valuation adjustments on derivatives on a prospective
basis. The Corporation no longer considers the probability of
default for both the counterparty and the Corporation when
calculating the counterparty CVA and DVA and now only considers
the probability of the counterparty defaulting for CVA and the
Corporation defaulting for DVA.
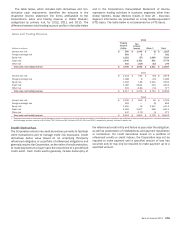
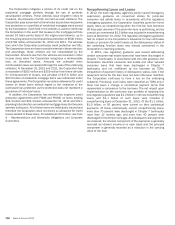
The table below presents CVA and DVA gains (losses) for the
Corporation on a gross and net of hedge basis, which are recorded
in trading account profits.
Valuation Adjustments on Derivatives
2012 2011
(Dollars in millions) Gross Net Gross Net
Derivative assets (CVA) (1) $ 1,022 $ 291 $ (1,863) $ (606)
Derivative liabilities (DVA) (2) (2,212) (2,477) 1,385 1,000
(1) At December 31, 2012 and 2011, the cumulative CVA reduced the derivative assets balance
by $2.4 billion and $2.8 billion.
(2) At December 31, 2012 and 2011, the Corporation’s cumulative DVA reduced the derivative
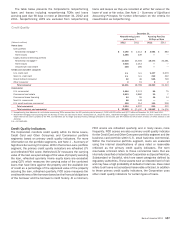
liabilities balance by $807 million and $2.4 billion.