Bank of America 2012 Annual Report Download - page 39
Download and view the complete annual report
Please find page 39 of the 2012 Bank of America annual report below. You can navigate through the pages in the report by either clicking on the pages listed below, or by using the keyword search tool below to find specific information within the annual report.-
 1
1 -
2
-
3
-
4
-
5
-
6
-
7
-
8
-
9
-
10
-
11
-
12
-
13
-
14
-
15
-
16
-
17
-
18
-
19
-
20
-
21
-
22
-
23
-
24
-
25
-
26
-
27
-
28
-
 29
29 -
 30
30 -
 31
31 -
 32
32 -
 33
33 -
 34
34 -
 35
35 -
 36
36 -
 37
37 -
 38
38 -
 39
39 -
 40
40 -
 41
41 -
 42
42 -
 43
43 -
 44
44 -
 45
45 -
 46
46 -
 47
47 -
 48
48 -
 49
49 -
50
-
51
-
52
-
53
-
54
-
55
-
56
-
57
-
58
-
59
-
60
-
61
-
62
-
63
-
64
-
65
-
66
-
67
-
68
-
69
-
70
-
71
-
72
-
73
-
74
-
75
-
76
-
77
-
78
-
79
-
80
-
81
-
82
-
83
-
84
-
85
-
86
-
87
-
88
-
89
-
90
-
91
-
92
-
93
-
94
-
95
-
96
-
97
-
98
-
99
-
100
-
101
-
102
-
103
-
104
-
105
-
106
-
107
-
108
-
109
-
110
-
111
-
112
-
113
-
114
-
115
-
116
-
117
-
118
-
119
-
120
-
121
-
122
-
123
-
124
-
125
-
126
-
127
-
128
-
129
-
130
-
131
-
132
-
133
-
134
-
135
-
136
-
137
-
138
-
139
-
140
-
141
-
142
-
143
-
144
-
145
-
146
-
147
-
148
-
149
-
150
-
151
-
152
-
153
-
154
-
155
-
156
-
157
-
158
-
159
-
160
-
161
-
162
-
163
-
164
-
165
-
166
-
167
-
168
-
169
-
170
-
171
-
172
-
173
-
174
-
175
-
176
-
177
-
178
-
179
-
180
-
181
-
182
-
183
-
184
-
185
-
186
-
187
-
188
-
189
-
190
-
191
-
192
-
193
-
194
-
195
-
196
-
197
-
198
-
199
-
200
-
201
-
202
-
203
-
204
-
205
-
206
-
207
-
208
-
209
-
210
-
211
-
212
-
213
-
214
-
215
-
216
-
217
-
218
-
219
-
220
-
221
-
222
-
223
-
224
-
225
-
226
-
227
-
228
-
229
-
230
-
231
-
232
-
233
-
234
-
235
-
236
-
237
-
238
-
239
-
240
-
241
-
242
-
243
-
244
-
245
-
246
-
247
-
248
-
249
-
250
-
251
-
252
-
253
-
254
-
255
-
256
-
257
-
258
-
259
-
260
-
261
-
262
-
263
-
264
-
265
-
266
-
267
-
268
-
269
-
270
-
271
-
272
-
273
-
274
-
275
-
276
-
277
-
278
-
279
-
280
-
281
-
282
-
283
-
284
 |
 |

Bank of America 2012 37
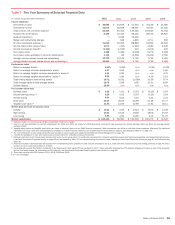
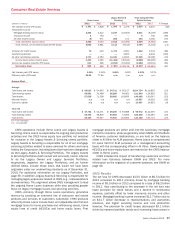
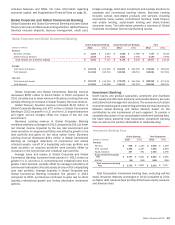
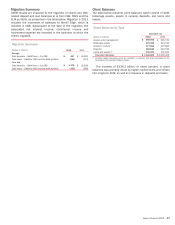
Consumer Real Estate Services
Home Loans
Legacy Assets &
Servicing
Total Consumer Real
Estate Services
(Dollars in millions) 2012 2011 2012 2011 2012 2011 % Change
Net interest income (FTE basis) $ 1,361 $ 1,828 $ 1,598 $ 1,379 $ 2,959 $ 3,207 (8)%
Noninterest income:
Mortgage banking income (loss) 3,284 2,312 2,247 (10,505) 5,531 (8,193) (168)
Insurance income 6750 ——6750 (99)
All other income (loss) (5) 971 268 111 263 1,082 (76)
Total noninterest income (loss) 3,285 4,033 2,515 (10,394) 5,800 (6,361) (191)
Total revenue, net of interest expense (FTE basis) 4,646 5,861 4,113 (9,015) 8,759 (3,154) n/m
Provision for credit losses 72 233 1,370 4,291 1,442 4,524 (68)
Goodwill impairment ———2,603 —2,603 (100)
All other noninterest expense 3,171 4,563 14,135 14,625 17,306 19,188 (10)
Income (loss) before income taxes 1,403 1,065 (11,392) (30,534) (9,989)(29,469) (66)
Income tax expense (benefit) (FTE basis) 511 396 (3,993)(10,400) (3,482)(10,004) (65)
Net income (loss) $ 892 $ 669 $(7,399)$ (20,134) $(6,507)$ (19,465) (67)
Net interest yield (FTE basis) 2.41% 2.59% 2.45%1.63% 2.43%2.07%
Efficiency ratio (FTE basis) 68.25 77.85 n/m n/m n/m n/m
Balance Sheet
Average
Total loans and leases $ 50,023 $ 54,663 $ 54,731 $ 65,157 $ 104,754 $119,820 (13)
Total earning assets 56,581 70,488 65,288 84,402 121,869 154,890 (21)
Total assets 57,550 71,508 89,055 118,859 146,605 190,367 (23)
Allocated equity n/a n/a n/a n/a 13,687 16,202 (16)
Economic capital n/a n/a n/a n/a 13,687 14,852 (8)
Year end
Total loans and leases $ 47,742 $ 52,371 $ 48,230 $ 59,988 $95,972 $112,359 (15)
Total earning assets 54,394 58,819 53,892 73,562 108,286 132,381 (18)
Total assets 55,463 59,647 76,925 104,065 132,388 163,712 (19)
n/m = not meaningful
n/a = not applicable
CRES operations include Home Loans and Legacy Assets &
Servicing. Home Loans is responsible for ongoing loan production
activities and the CRES home equity loan portfolio not selected
for inclusion in the Legacy Assets & Servicing owned portfolio.
Legacy Assets & Servicing is responsible for all of our mortgage
servicing activities related to loans serviced for others and loans
held by the Corporation, including loans that have been designated
as the Legacy Assets & Servicing Portfolios. The Legacy Assets
& Servicing Portfolios (both owned and serviced), herein referred
to as the Legacy Owned and Legacy Serviced Portfolios,
respectively, (together, the Legacy Portfolios), and as further
defined below, include those loans that would not have been
originated under our underwriting standards as of December 31,
2010. For additional information on our Legacy Portfolios, see
page 39. In addition, Legacy Assets & Servicing is responsible for
managing legacy exposures related to CRES (e.g., representations
and warranties). This alignment allows CRES management to lead
the ongoing Home Loans business while also providing greater
focus on legacy mortgage issues and servicing activities.
CRES, primarily through Home Loans operations, generates
revenue by providing an extensive line of consumer real estate
products and services to customers nationwide. CRES products
offered by Home Loans include fixed- and adjustable-rate first-lien
mortgage loans for home purchase and refinancing needs, home
equity lines of credit (HELOCs) and home equity loans. First
mortgage products are either sold into the secondary mortgage
market to investors, while we generally retain MSRs and the Bank
of America customer relationships, or are held on the balance
sheet in All Other for ALM purposes. Home Loans is compensated
for loans held for ALM purposes on a management accounting
basis with the corresponding offset in All Other. Newly originated
HELOCs and home equity loans are retained on the CRES balance
sheet in Home Loans.
CRES includes the impact of transferring customers and their
related loan balances between GWIM and CRES. For more
information on the migration of customer balances, see GWIM on
page 46.
CRES Results
The net loss for CRES decreased $13.0 billion to $6.5 billion for
2012 compared to 2011 primarily driven by mortgage banking
income of $5.5 billion in 2012 compared to a loss of $8.2 billion
in 2011. Also contributing to the decrease in the net loss was
lower provision for credit losses and a decline in noninterest
expense, partially offset by lower insurance income and other
income. Mortgage banking income increased $13.7 billion due to
an $11.7 billion decrease in representations and warranties
provision, and higher servicing income and core production
revenue. The provision for credit losses decreased $3.1 billion
driven by improved portfolio trends and increasing home prices in