Bank of America 2012 Annual Report Download - page 73
Download and view the complete annual report
Please find page 73 of the 2012 Bank of America annual report below. You can navigate through the pages in the report by either clicking on the pages listed below, or by using the keyword search tool below to find specific information within the annual report.-
 1
1 -
2
-
3
-
4
-
5
-
6
-
7
-
8
-
9
-
10
-
11
-
12
-
13
-
14
-
15
-
16
-
17
-
18
-
19
-
20
-
21
-
22
-
23
-
24
-
25
-
26
-
27
-
28
-
29
-
30
-
31
-
32
-
33
-
34
-
35
-
36
-
37
-
38
-
39
-
40
-
41
-
42
-
43
-
44
-
45
-
46
-
47
-
48
-
49
-
50
-
51
-
52
-
53
-
54
-
55
-
56
-
57
-
58
-
59
-
60
-
61
-
62
-
 63
63 -
 64
64 -
 65
65 -
 66
66 -
 67
67 -
 68
68 -
 69
69 -
 70
70 -
 71
71 -
 72
72 -
 73
73 -
 74
74 -
 75
75 -
 76
76 -
 77
77 -
 78
78 -
 79
79 -
 80
80 -
 81
81 -
 82
82 -
 83
83 -
84
-
85
-
86
-
87
-
88
-
89
-
90
-
91
-
92
-
93
-
94
-
95
-
96
-
97
-
98
-
99
-
100
-
101
-
102
-
103
-
104
-
105
-
106
-
107
-
108
-
109
-
110
-
111
-
112
-
113
-
114
-
115
-
116
-
117
-
118
-
119
-
120
-
121
-
122
-
123
-
124
-
125
-
126
-
127
-
128
-
129
-
130
-
131
-
132
-
133
-
134
-
135
-
136
-
137
-
138
-
139
-
140
-
141
-
142
-
143
-
144
-
145
-
146
-
147
-
148
-
149
-
150
-
151
-
152
-
153
-
154
-
155
-
156
-
157
-
158
-
159
-
160
-
161
-
162
-
163
-
164
-
165
-
166
-
167
-
168
-
169
-
170
-
171
-
172
-
173
-
174
-
175
-
176
-
177
-
178
-
179
-
180
-
181
-
182
-
183
-
184
-
185
-
186
-
187
-
188
-
189
-
190
-
191
-
192
-
193
-
194
-
195
-
196
-
197
-
198
-
199
-
200
-
201
-
202
-
203
-
204
-
205
-
206
-
207
-
208
-
209
-
210
-
211
-
212
-
213
-
214
-
215
-
216
-
217
-
218
-
219
-
220
-
221
-
222
-
223
-
224
-
225
-
226
-
227
-
228
-
229
-
230
-
231
-
232
-
233
-
234
-
235
-
236
-
237
-
238
-
239
-
240
-
241
-
242
-
243
-
244
-
245
-
246
-
247
-
248
-
249
-
250
-
251
-
252
-
253
-
254
-
255
-
256
-
257
-
258
-
259
-
260
-
261
-
262
-
263
-
264
-
265
-
266
-
267
-
268
-
269
-
270
-
271
-
272
-
273
-
274
-
275
-
276
-
277
-
278
-
279
-
280
-
281
-
282
-
283
-
284
 |
 |

Bank of America 2012 71
Market Risk Capital
Market risk reflects the potential loss in the value of financial
instruments or portfolios due to movements in interest and
currency exchange rates, equity and futures prices, the implied
volatility of interest rates, credit spreads, and other economic and
business factors. The Corporation’s primary market risk exposures
are in its trading portfolio, equity investments, MSRs and the
interest rate exposure of our core balance sheet. Economic capital
is determined by utilizing the same models we use to manage
these risks including, for example, VaR, simulation, stress testing
and scenario analysis. See page 109 for additional information
on Market Risk Management.
Operational Risk Capital
We calculate operational risk capital at the business unit level
using actuarial-based models and historical loss data. We
supplement the calculations with scenario analysis and risk control
assessments. See Operational Risk Management on page 116
for more information.
Common Stock Dividends
For a summary of our declared quarterly cash dividends on
common stock during 2012 and through February 28, 2013, see
Note 14 – Shareholders’ Equity to the Consolidated Financial
Statements.
Liquidity Risk
Funding and Liquidity Risk Management
We define liquidity risk as the potential inability to meet our
contractual and contingent financial obligations, on- or off-balance
sheet, as they come due. Our primary liquidity objective is to
provide adequate funding for our businesses throughout market
cycles, including periods of financial stress. To achieve that
objective, we analyze and monitor our liquidity risk, maintain excess
liquidity and access diverse funding sources including our stable
deposit base. We define excess liquidity as readily available
assets, limited to cash and high-quality, liquid, unencumbered
securities that we can use to meet our funding requirements as
those obligations arise.
Global funding and liquidity risk management activities are
centralized within Corporate Treasury. We believe that a centralized
approach to funding and liquidity risk management enhances our
ability to monitor liquidity requirements, maximizes access to
funding sources, minimizes borrowing costs and facilitates timely
responses to liquidity events.
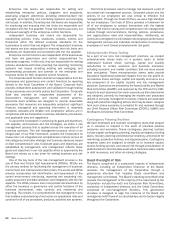
The Enterprise Risk Committee approves the Corporation’s
liquidity policy and contingency funding plan, including establishing
liquidity risk tolerance levels. The ALMRC monitors our liquidity
position and reviews the impact of strategic decisions on our
liquidity. ALMRC is responsible for managing liquidity risks and
maintaining exposures within the established tolerance levels.
ALMRC delegates additional oversight responsibilities to the
CFORC, which reports to the ALMRC. The CFORC reviews and
monitors our liquidity position, cash flow forecasts, stress testing
scenarios and results, and implements our liquidity limits and
guidelines. For more information, see Board Oversight of Risk on
page 64. Under this governance framework, we have developed
certain funding and liquidity risk management practices which
include: maintaining excess liquidity at the parent company and
selected subsidiaries, including our bank and broker/dealer
subsidiaries; determining what amounts of excess liquidity are
appropriate for these entities based on analysis of debt maturities
and other potential cash outflows, including those that we may
experience during stressed market conditions; diversifying funding
sources, considering our asset profile and legal entity structure;
and performing contingency planning.
Global Excess Liquidity Sources and Other
Unencumbered Assets
We maintain excess liquidity available to Bank of America
Corporation, or the parent company, and selected subsidiaries in
the form of cash and high-quality, liquid, unencumbered securities.
These assets, which we call our Global Excess Liquidity Sources,
serve as our primary means of liquidity risk mitigation. Our cash
is primarily on deposit with the Federal Reserve and central banks
outside of the U.S. We limit the composition of high-quality, liquid,
unencumbered securities to U.S. government securities, U.S.
agency securities, U.S. agency MBS and a select group of non-
U.S. government and supranational securities. We believe we can
quickly obtain cash for these securities, even in stressed market
conditions, through repurchase agreements or outright sales. We
hold our Global Excess Liquidity Sources in entities that allow us
to meet the liquidity requirements of our global businesses, and
we consider the impact of potential regulatory, tax, legal and other
restrictions that could limit the transferability of funds among
entities.
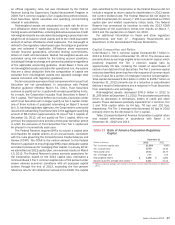
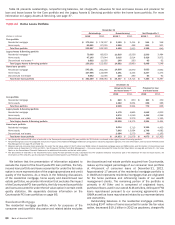
Our Global Excess Liquidity Sources were $372 billion and
$378 billion at December 31, 2012 and 2011 and were maintained
as presented in Table 17.
Table 17 Global Excess Liquidity Sources
December 31
Average for
Three Months
Ended
December 31
2012
(Dollars in billions) 2012 2011
Parent company $ 103 $ 125 $ 99
Bank subsidiaries 247 222 264
Broker/dealers 22 31 25
Total global excess liquidity sources $ 372 $ 378 $ 388
As shown in Table 17, parent company Global Excess Liquidity
Sources totaled $103 billion and $125 billion at December 31,
2012 and 2011. The decrease in parent company liquidity was
primarily due to reductions in long-term debt, partially offset by
dividends and capital repayments from subsidiaries. Typically,
parent company cash is deposited overnight with BANA.
Global Excess Liquidity Sources available to our bank
subsidiaries totaled $247 billion and $222 billion at December 31,
2012 and 2011. These amounts are distinct from the cash
deposited by the parent company. The increase in liquidity available
to our bank subsidiaries was primarily due to an increase in
deposits, partially offset by capital returns to the parent company
and reductions in debt. In addition to their Global Excess Liquidity
Sources, our bank subsidiaries hold other unencumbered
investment-grade securities that we believe could also be used to
generate liquidity. Our bank subsidiaries can also generate
incremental liquidity by pledging a range of other unencumbered
loans and securities to certain Federal Home Loan Banks (FHLBs)
and the Federal Reserve Discount Window. The cash we could have
obtained by borrowing against this pool of specifically-identified