Bank of America 2012 Annual Report Download - page 206
Download and view the complete annual report
Please find page 206 of the 2012 Bank of America annual report below. You can navigate through the pages in the report by either clicking on the pages listed below, or by using the keyword search tool below to find specific information within the annual report.-
 1
1 -
2
-
3
-
4
-
5
-
6
-
7
-
8
-
9
-
10
-
11
-
12
-
13
-
14
-
15
-
16
-
17
-
18
-
19
-
20
-
21
-
22
-
23
-
24
-
25
-
26
-
27
-
28
-
29
-
30
-
31
-
32
-
33
-
34
-
35
-
36
-
37
-
38
-
39
-
40
-
41
-
42
-
43
-
44
-
45
-
46
-
47
-
48
-
49
-
50
-
51
-
52
-
53
-
54
-
55
-
56
-
57
-
58
-
59
-
60
-
61
-
62
-
63
-
64
-
65
-
66
-
67
-
68
-
69
-
70
-
71
-
72
-
73
-
74
-
75
-
76
-
77
-
78
-
79
-
80
-
81
-
82
-
83
-
84
-
85
-
86
-
87
-
88
-
89
-
90
-
91
-
92
-
93
-
94
-
95
-
96
-
97
-
98
-
99
-
100
-
101
-
102
-
103
-
104
-
105
-
106
-
107
-
108
-
109
-
110
-
111
-
112
-
113
-
114
-
115
-
116
-
117
-
118
-
119
-
120
-
121
-
122
-
123
-
124
-
125
-
126
-
127
-
128
-
129
-
130
-
131
-
132
-
133
-
134
-
135
-
136
-
137
-
138
-
139
-
140
-
141
-
142
-
143
-
144
-
145
-
146
-
147
-
148
-
149
-
150
-
151
-
152
-
153
-
154
-
155
-
156
-
157
-
158
-
159
-
160
-
161
-
162
-
163
-
164
-
165
-
166
-
167
-
168
-
169
-
170
-
171
-
172
-
173
-
174
-
175
-
176
-
177
-
178
-
179
-
180
-
181
-
182
-
183
-
184
-
185
-
186
-
187
-
188
-
189
-
190
-
191
-
192
-
193
-
194
-
195
-
 196
196 -
 197
197 -
 198
198 -
 199
199 -
 200
200 -
 201
201 -
 202
202 -
 203
203 -
 204
204 -
 205
205 -
 206
206 -
 207
207 -
 208
208 -
 209
209 -
 210
210 -
 211
211 -
 212
212 -
 213
213 -
 214
214 -
 215
215 -
 216
216 -
217
-
218
-
219
-
220
-
221
-
222
-
223
-
224
-
225
-
226
-
227
-
228
-
229
-
230
-
231
-
232
-
233
-
234
-
235
-
236
-
237
-
238
-
239
-
240
-
241
-
242
-
243
-
244
-
245
-
246
-
247
-
248
-
249
-
250
-
251
-
252
-
253
-
254
-
255
-
256
-
257
-
258
-
259
-
260
-
261
-
262
-
263
-
264
-
265
-
266
-
267
-
268
-
269
-
270
-
271
-
272
-
273
-
274
-
275
-
276
-
277
-
278
-
279
-
280
-
281
-
282
-
283
-
284
 |
 |

204 Bank of America 2012
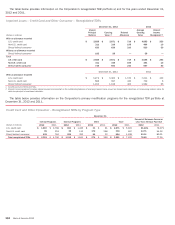
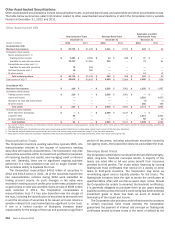
Other Asset-backed Securitizations
Other asset-backed securitizations include resecuritization trusts, municipal bond trusts, and automobile and other securitization trusts.
The table below summarizes select information related to other asset-backed securitizations in which the Corporation held a variable
interest at December 31, 2012 and 2011.
Other Asset-backed VIEs
Resecuritization Trusts Municipal Bond Trusts
Automobile and Other
Securitization Trusts
December 31 December 31 December 31
(Dollars in millions) 2012 2011 2012 2011 2012 2011
Unconsolidated VIEs
Maximum loss exposure $ 20,715 $ 31,140 $ 3,341 $ 3,752 $122 $ 93
On-balance sheet assets
Senior securities held (1, 2):
Trading account assets $ 1,281 $ 2,595 $ 12 $ 228 $37 $—
Available-for-sale debt securities 19,343 27,616 540 —74 81
Subordinate securities held (1, 2):
Available-for-sale debt securities 75 544 ————
Residual interests held (3) 16 385 ————
All other assets ————11 12
Total retained positions $ 20,715 $ 31,140 $552 $ 228 $122 $ 93
Total assets of VIEs (4) $ 42,818 $ 60,459 $ 4,980 $ 5,964 $ 1,890 $ 668
Consolidated VIEs
Maximum loss exposure $ 126 $—
$ 2,505 $ 3,901 $ 1,255 $ 1,087
On-balance sheet assets
Trading account assets $ 220 $—
$ 2,505 $ 3,901 $—$—
Loans and leases ————2,523 4,923
Allowance for loan and lease losses ————(2)(7)
All other assets ————250 168
Total assets $ 220 $—
$ 2,505 $ 3,901 $ 2,771 $ 5,084
On-balance sheet liabilities
Other short-term borrowings $—
$—
$ 2,859 $ 5,127 $—$—
Long-term debt 94 ———1,513 3,992
All other liabilities ————82 90
Total liabilities $ 94 $—
$ 2,859 $ 5,127 $ 1,595 $ 4,082
(1) As a holder of these securities, the Corporation receives scheduled principal and interest payments. During 2012 and 2011, there were no OTTI losses recorded on those securities classified as
AFS debt securities.
(2) The retained senior and subordinate securities were valued using quoted market prices or observable market inputs (Level 2 of the fair value hierarchy).
(3) The retained residual interests are carried at fair value which was derived using model valuations (Level 2 of the fair value hierarchy).
(4) Total assets include loans the Corporation transferred with which the Corporation has continuing involvement, which may include servicing the loan.
Resecuritization Trusts
The Corporation transfers existing securities, typically MBS, into
resecuritization vehicles at the request of customers seeking
securities with specific characteristics. The Corporation may also
resecuritize securities within its investment portfolio for purposes
of improving liquidity and capital, and managing credit or interest
rate risk. Generally, there are no significant ongoing activities
performed in a resecuritization trust and no single investor has
the unilateral ability to liquidate the trust.
The Corporation resecuritized $45.6 billion of securities in
2012 and $33.6 billion in 2011. All of the securities transferred
into resecuritization vehicles during 2012 were classified as
trading account assets. As such, changes in fair value were
recorded in trading account profits prior to the resecuritization and
no gain or loss on sale was recorded. Gains on sale of $909 million
were recorded in 2011. The Corporation consolidates a
resecuritization trust if it has sole discretion over the design of
the trust, including the identification of securities to be transferred
in and the structure of securities to be issued, and also retains a
variable interest that could potentially be significant to the trust.
If one or a limited number of third-party investors share
responsibility for the design of the trust and purchase a significant
portion of securities, including subordinate securities issued by
non-agency trusts, the Corporation does not consolidate the trust.
Municipal Bond Trusts
The Corporation administers municipal bond trusts that hold highly-
rated, long-term, fixed-rate municipal bonds. A majority of the
bonds are rated AAA or AA and some benefit from insurance
provided by third parties. The trusts obtain financing by issuing
floating-rate trust certificates that reprice on a weekly or other
basis to third-party investors. The Corporation may serve as
remarketing agent and/or liquidity provider for the trusts. The
floating-rate investors have the right to tender the certificates at
specified dates, often with as little as seven days’ notice. Should
the Corporation be unable to remarket the tendered certificates,
it is generally obligated to purchase them at par under standby
liquidity facilities unless the bond’s credit rating has declined below
investment grade or there has been an event of default or
bankruptcy of the issuer and insurer.
The Corporation also provides credit enhancement to investors
in certain municipal bond trusts whereby the Corporation
guarantees the payment of interest and principal on floating-rate
certificates issued by these trusts in the event of default by the