Bank of America 2012 Annual Report Download - page 220
Download and view the complete annual report
Please find page 220 of the 2012 Bank of America annual report below. You can navigate through the pages in the report by either clicking on the pages listed below, or by using the keyword search tool below to find specific information within the annual report.-
 1
1 -
2
-
3
-
4
-
5
-
6
-
7
-
8
-
9
-
10
-
11
-
12
-
13
-
14
-
15
-
16
-
17
-
18
-
19
-
20
-
21
-
22
-
23
-
24
-
25
-
26
-
27
-
28
-
29
-
30
-
31
-
32
-
33
-
34
-
35
-
36
-
37
-
38
-
39
-
40
-
41
-
42
-
43
-
44
-
45
-
46
-
47
-
48
-
49
-
50
-
51
-
52
-
53
-
54
-
55
-
56
-
57
-
58
-
59
-
60
-
61
-
62
-
63
-
64
-
65
-
66
-
67
-
68
-
69
-
70
-
71
-
72
-
73
-
74
-
75
-
76
-
77
-
78
-
79
-
80
-
81
-
82
-
83
-
84
-
85
-
86
-
87
-
88
-
89
-
90
-
91
-
92
-
93
-
94
-
95
-
96
-
97
-
98
-
99
-
100
-
101
-
102
-
103
-
104
-
105
-
106
-
107
-
108
-
109
-
110
-
111
-
112
-
113
-
114
-
115
-
116
-
117
-
118
-
119
-
120
-
121
-
122
-
123
-
124
-
125
-
126
-
127
-
128
-
129
-
130
-
131
-
132
-
133
-
134
-
135
-
136
-
137
-
138
-
139
-
140
-
141
-
142
-
143
-
144
-
145
-
146
-
147
-
148
-
149
-
150
-
151
-
152
-
153
-
154
-
155
-
156
-
157
-
158
-
159
-
160
-
161
-
162
-
163
-
164
-
165
-
166
-
167
-
168
-
169
-
170
-
171
-
172
-
173
-
174
-
175
-
176
-
177
-
178
-
179
-
180
-
181
-
182
-
183
-
184
-
185
-
186
-
187
-
188
-
189
-
190
-
191
-
192
-
193
-
194
-
195
-
196
-
197
-
198
-
199
-
200
-
201
-
202
-
203
-
204
-
205
-
206
-
207
-
208
-
209
-
 210
210 -
 211
211 -
 212
212 -
 213
213 -
 214
214 -
 215
215 -
 216
216 -
 217
217 -
 218
218 -
 219
219 -
 220
220 -
 221
221 -
 222
222 -
 223
223 -
 224
224 -
 225
225 -
 226
226 -
 227
227 -
 228
228 -
 229
229 -
 230
230 -
231
-
232
-
233
-
234
-
235
-
236
-
237
-
238
-
239
-
240
-
241
-
242
-
243
-
244
-
245
-
246
-
247
-
248
-
249
-
250
-
251
-
252
-
253
-
254
-
255
-
256
-
257
-
258
-
259
-
260
-
261
-
262
-
263
-
264
-
265
-
266
-
267
-
268
-
269
-
270
-
271
-
272
-
273
-
274
-
275
-
276
-
277
-
278
-
279
-
280
-
281
-
282
-
283
-
284
 |
 |

218 Bank of America 2012
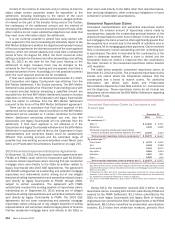
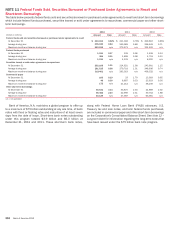
NOTE 11 Federal Funds Sold, Securities Borrowed or Purchased Under Agreements to Resell and
Short-term Borrowings
The table below presents federal funds sold and securities borrowed or purchased under agreements to resell and short-term borrowings
which include federal funds purchased, securities loaned or sold under agreements to repurchase, commercial paper and other short-
term borrowings.
2012 2011 2010
(Dollars in millions) Amount Rate Amount Rate Amount Rate
Federal funds sold and securities borrowed or purchased under agreements to resell
At December 31 $ 219,924 0.92%$211,183 0.76% $ 209,616 0.85%
Average during year 236,042 0.64 245,069 0.88 256,943 0.71
Maximum month-end balance during year 253,535 n/a 270,473 n/a 314,932 n/a
Federal funds purchased
At December 31 1,151 0.17 243 0.06 1,458 0.14
Average during year 384 0.11 1,658 0.08 4,718 0.15
Maximum month-end balance during year 1,211 n/a 4,133 n/a 8,320 n/a
Securities loaned or sold under agreements to repurchase
At December 31 292,108 1.11 214,621 1.08 243,901 1.15
Average during year 281,515 0.98 270,718 1.31 348,936 0.74
Maximum month-end balance during year 319,401 n/a 293,519 n/a 458,532 n/a
Commercial paper
At December 31 100 0.19 23 1.70 15,093 0.65
Average during year 49 0.30 8,897 0.53 25,923 0.56
Maximum month-end balance during year 172 n/a 21,212 n/a 36,236 n/a
Other short-term borrowings
At December 31 30,631 3.14 35,675 2.35 44,869 2.02
Average during year 36,452 2.23 42,996 2.31 50,752 1.88
Maximum month-end balance during year 40,129 n/a 47,087 n/a 63,081 n/a
n/a = not applicable
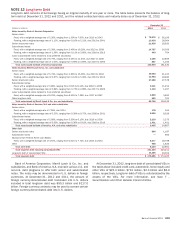
Bank of America, N.A. maintains a global program to offer up
to a maximum of $75 billion outstanding at any one time, of bank
notes with fixed or floating rates and maturities of at least seven
days from the date of issue. Short-term bank notes outstanding
under this program totaled $3.9 billion and $6.3 billion at
December 31, 2012 and 2011. These short-term bank notes,
along with Federal Home Loan Bank (FHLB) advances, U.S.
Treasury tax and loan notes, and term federal funds purchased,
are included in commercial paper and other short-term borrowings
on the Corporation’s Consolidated Balance Sheet. See Note 12 –
Long-term Debt for information regarding the long-term notes that
have been issued under the $75 billion bank note program.