Bank of America 2012 Annual Report Download - page 252
Download and view the complete annual report
Please find page 252 of the 2012 Bank of America annual report below. You can navigate through the pages in the report by either clicking on the pages listed below, or by using the keyword search tool below to find specific information within the annual report.-
 1
1 -
2
-
3
-
4
-
5
-
6
-
7
-
8
-
9
-
10
-
11
-
12
-
13
-
14
-
15
-
16
-
17
-
18
-
19
-
20
-
21
-
22
-
23
-
24
-
25
-
26
-
27
-
28
-
29
-
30
-
31
-
32
-
33
-
34
-
35
-
36
-
37
-
38
-
39
-
40
-
41
-
42
-
43
-
44
-
45
-
46
-
47
-
48
-
49
-
50
-
51
-
52
-
53
-
54
-
55
-
56
-
57
-
58
-
59
-
60
-
61
-
62
-
63
-
64
-
65
-
66
-
67
-
68
-
69
-
70
-
71
-
72
-
73
-
74
-
75
-
76
-
77
-
78
-
79
-
80
-
81
-
82
-
83
-
84
-
85
-
86
-
87
-
88
-
89
-
90
-
91
-
92
-
93
-
94
-
95
-
96
-
97
-
98
-
99
-
100
-
101
-
102
-
103
-
104
-
105
-
106
-
107
-
108
-
109
-
110
-
111
-
112
-
113
-
114
-
115
-
116
-
117
-
118
-
119
-
120
-
121
-
122
-
123
-
124
-
125
-
126
-
127
-
128
-
129
-
130
-
131
-
132
-
133
-
134
-
135
-
136
-
137
-
138
-
139
-
140
-
141
-
142
-
143
-
144
-
145
-
146
-
147
-
148
-
149
-
150
-
151
-
152
-
153
-
154
-
155
-
156
-
157
-
158
-
159
-
160
-
161
-
162
-
163
-
164
-
165
-
166
-
167
-
168
-
169
-
170
-
171
-
172
-
173
-
174
-
175
-
176
-
177
-
178
-
179
-
180
-
181
-
182
-
183
-
184
-
185
-
186
-
187
-
188
-
189
-
190
-
191
-
192
-
193
-
194
-
195
-
196
-
197
-
198
-
199
-
200
-
201
-
202
-
203
-
204
-
205
-
206
-
207
-
208
-
209
-
210
-
211
-
212
-
213
-
214
-
215
-
216
-
217
-
218
-
219
-
220
-
221
-
222
-
223
-
224
-
225
-
226
-
227
-
228
-
229
-
230
-
231
-
232
-
233
-
234
-
235
-
236
-
237
-
238
-
239
-
240
-
241
-
 242
242 -
 243
243 -
 244
244 -
 245
245 -
 246
246 -
 247
247 -
 248
248 -
 249
249 -
 250
250 -
 251
251 -
 252
252 -
 253
253 -
 254
254 -
 255
255 -
 256
256 -
 257
257 -
 258
258 -
 259
259 -
 260
260 -
 261
261 -
 262
262 -
263
-
264
-
265
-
266
-
267
-
268
-
269
-
270
-
271
-
272
-
273
-
274
-
275
-
276
-
277
-
278
-
279
-
280
-
281
-
282
-
283
-
284
 |
 |

250 Bank of America 2012
is less than a specified minimum value, in which case the minimum
value is paid in cash. At December 31, 2012, there were 11 million
shares outstanding under this plan.
The ESPP was discontinued on March 31, 2012. The final
discounted purchase was made on April 13, 2012. The ESPP
allowed eligible employees to invest from one percent to 10
percent of eligible compensation to purchase the Corporation’s
common stock, subject to legal limits. Purchases were made at a
discount of five percent of the average high and low market price
on the relevant purchase date and the maximum annual
contribution per employee was $23,750 in 2012.
The weighted-average fair value of the ESPP stock purchase
rights representing the five percent discount on the Corporation’s
common stock purchases exercised by employees in 2012 was
$0.39 per stock purchase right.
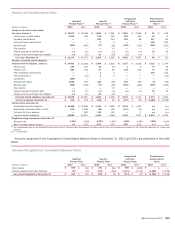
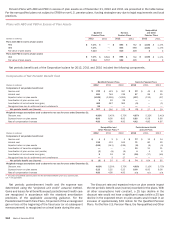
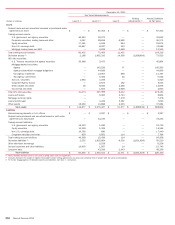
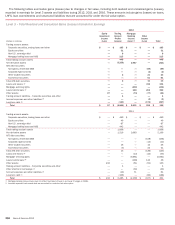
Restricted Stock/Units
The table below presents the status of the share-settled restricted
stock/units at December 31, 2012 and changes during 2012.
Restricted Stock/Units
Shares/Units
Weighted-
average Grant
Date Fair Value
Outstanding at January 1, 2012 253,966,818 $ 13.46
Granted 196,979,019 7.78
Vested (293,968,254) 9.80
Canceled (9,407,186) 13.46
Outstanding at December 31, 2012 147,570,397 $ 13.18
Of the 197 million share-settled shares/units granted above,
190 million were granted as awards of restricted stock shares that
vested and were released from restrictions on the grant date.
The table below presents the status at December 31, 2012 of
the cash-settled RSUs granted under the Key Associate Stock Plan
and changes during 2012.
Restricted Unit Details
Units
Outstanding at January 1, 2012 117,439,155
Granted 283,196,745
Vested (53,912,279)
Canceled (17,167,153)
Outstanding at December 31, 2012 329,556,468
At December 31, 2012, there was $1.7 billion of total
unrecognized compensation cost related to share-based
compensation arrangements for all awards and it is expected to
be recognized over a period up to seven years, with a weighted-
average period of .5 years. The total fair value of restricted stock
vested in 2012, 2011 and 2010 was $2.9 billion, $1.7 billion and
$2.4 billion, respectively. In 2012, 2011 and 2010 the amount of
cash paid to settle equity-based awards for all equity compensation
plans was $779 million, $489 million and $186 million,
respectively.
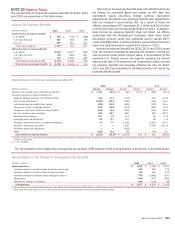
Stock Options
The table below presents the status of all option plans at
December 31, 2012 and changes during 2012. Outstanding
options at December 31, 2012 include 130 million options under
the Key Associate Stock Plan and 25 million options to employees
of predecessor company plans assumed in mergers.
Stock Options
Options
Weighted-
average
Exercise Price
Outstanding at January 1, 2012 208,269,549 $ 46.93
Forfeited (53,345,926) 49.02
Outstanding at December 31, 2012 154,923,623 46.22
Options exercisable at December 31, 2012 154,922,583 46.22
Options vested and expected to vest (1) 154,923,623 46.22
(1) Includes vested shares and nonvested shares after a forfeiture rate is applied.
At December 31, 2012, there was no aggregate intrinsic value
of options outstanding, exercisable, and vested and expected to
vest. The weighted-average remaining contractual term of options
outstanding, exercisable, and vested and expected to vest was
2.4 years at December 31, 2012. These remaining contractual
terms are the same because options have not been granted since
2008 and they generally vest over three years.