Bank of America 2012 Annual Report Download - page 248
Download and view the complete annual report
Please find page 248 of the 2012 Bank of America annual report below. You can navigate through the pages in the report by either clicking on the pages listed below, or by using the keyword search tool below to find specific information within the annual report.-
 1
1 -
2
-
3
-
4
-
5
-
6
-
7
-
8
-
9
-
10
-
11
-
12
-
13
-
14
-
15
-
16
-
17
-
18
-
19
-
20
-
21
-
22
-
23
-
24
-
25
-
26
-
27
-
28
-
29
-
30
-
31
-
32
-
33
-
34
-
35
-
36
-
37
-
38
-
39
-
40
-
41
-
42
-
43
-
44
-
45
-
46
-
47
-
48
-
49
-
50
-
51
-
52
-
53
-
54
-
55
-
56
-
57
-
58
-
59
-
60
-
61
-
62
-
63
-
64
-
65
-
66
-
67
-
68
-
69
-
70
-
71
-
72
-
73
-
74
-
75
-
76
-
77
-
78
-
79
-
80
-
81
-
82
-
83
-
84
-
85
-
86
-
87
-
88
-
89
-
90
-
91
-
92
-
93
-
94
-
95
-
96
-
97
-
98
-
99
-
100
-
101
-
102
-
103
-
104
-
105
-
106
-
107
-
108
-
109
-
110
-
111
-
112
-
113
-
114
-
115
-
116
-
117
-
118
-
119
-
120
-
121
-
122
-
123
-
124
-
125
-
126
-
127
-
128
-
129
-
130
-
131
-
132
-
133
-
134
-
135
-
136
-
137
-
138
-
139
-
140
-
141
-
142
-
143
-
144
-
145
-
146
-
147
-
148
-
149
-
150
-
151
-
152
-
153
-
154
-
155
-
156
-
157
-
158
-
159
-
160
-
161
-
162
-
163
-
164
-
165
-
166
-
167
-
168
-
169
-
170
-
171
-
172
-
173
-
174
-
175
-
176
-
177
-
178
-
179
-
180
-
181
-
182
-
183
-
184
-
185
-
186
-
187
-
188
-
189
-
190
-
191
-
192
-
193
-
194
-
195
-
196
-
197
-
198
-
199
-
200
-
201
-
202
-
203
-
204
-
205
-
206
-
207
-
208
-
209
-
210
-
211
-
212
-
213
-
214
-
215
-
216
-
217
-
218
-
219
-
220
-
221
-
222
-
223
-
224
-
225
-
226
-
227
-
228
-
229
-
230
-
231
-
232
-
233
-
234
-
235
-
236
-
237
-
 238
238 -
 239
239 -
 240
240 -
 241
241 -
 242
242 -
 243
243 -
 244
244 -
 245
245 -
 246
246 -
 247
247 -
 248
248 -
 249
249 -
 250
250 -
 251
251 -
 252
252 -
 253
253 -
 254
254 -
 255
255 -
 256
256 -
 257
257 -
 258
258 -
259
-
260
-
261
-
262
-
263
-
264
-
265
-
266
-
267
-
268
-
269
-
270
-
271
-
272
-
273
-
274
-
275
-
276
-
277
-
278
-
279
-
280
-
281
-
282
-
283
-
284
 |
 |

246 Bank of America 2012
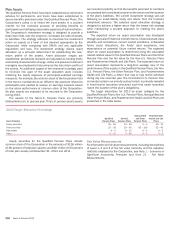
Plan Assets
The Qualified Pension Plans have been established as retirement
vehicles for participants, and trusts have been established to
secure benefits promised under the Qualified Pension Plans. The
Corporation’s policy is to invest the trust assets in a prudent
manner for the exclusive purpose of providing benefits to
participants and defraying reasonable expenses of administration.
The Corporation’s investment strategy is designed to provide a
total return that, over the long term, increases the ratio of assets
to liabilities. The strategy attempts to maximize the investment
return on assets at a level of risk deemed appropriate by the
Corporation while complying with ERISA and any applicable
regulations and laws. The investment strategy utilizes asset
allocation as a principal determinant for establishing the risk/
return profile of the assets. Asset allocation ranges are
established, periodically reviewed and adjusted as funding levels
and liability characteristics change. Active and passive investment
managers are employed to help enhance the risk/return profile of
the assets. An additional aspect of the investment strategy used
to minimize risk (part of the asset allocation plan) includes
matching the equity exposure of participant-selected earnings
measures. For example, the common stock of the Corporation held
in the trust is maintained as an offset to the exposure related to
participants who elected to receive an earnings measure based
on the return performance of common stock of the Corporation.
No plan assets are expected to be returned to the Corporation
during 2013.
The assets of the Non-U.S. Pension Plans are primarily
attributable to a U.K. pension plan. This U.K. pension plan’s assets
are invested prudently so that the benefits promised to members
are provided with consideration given to the nature and the duration
of the plan’s liabilities. The current investment strategy was set
following an asset-liability study and advice from the trustee’s
investment advisors. The selected asset allocation strategy is
designed to achieve a higher return than the lowest risk strategy
while maintaining a prudent approach to meeting the plan’s
liabilities.
The expected return on asset assumption was developed
through analysis of historical market returns, historical asset class
volatility and correlations, current market conditions, anticipated
future asset allocations, the funds’ past experience, and
expectations on potential future market returns. The expected
return on asset assumption is determined using the calculated
market-related value for the Qualified Pension Plans and the Other
Pension Plan and the fair value for the Non-U.S. Pension Plans
and Postretirement Health and Life Plans. The expected return on
asset assumption represents a long-term average view of the
performance of the assets in the Qualified Pension Plans, the Non-
U.S. Pension Plans, the Other Pension Plan, and Postretirement
Health and Life Plans, a return that may or may not be achieved
during any one calendar year. The terminated U.S. Pension Plan
is invested solely in an annuity contract which is primarily invested
in fixed-income securities structured such that asset maturities
match the duration of the plan’s obligations.
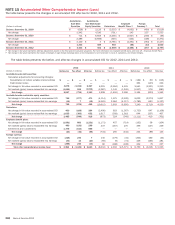
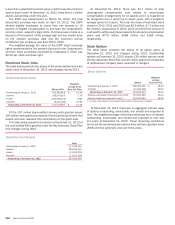
The target allocations for 2013 by asset category for the
Qualified Pension Plans, Non-U.S. Pension Plans, Nonqualified and
Other Pension Plans, and Postretirement Health and Life Plans are
presented in the table below.
2013 Target Allocation Percentage
Asset Category
Qualified
Pension Plans
Non-U.S.
Pension Plans
Nonqualified
and Other
Pension Plans
Postretirement
Health and Life
Plans
Equity securities 50 – 80 10 – 60 0 – 5 50 – 75
Debt securities 25 – 50 20 – 65 95 – 100 25 – 45
Real estate 0 – 5 0 – 15 0 – 5 0 – 5
Other 0 – 10 5 – 40 0 – 5 0 – 5
Equity securities for the Qualified Pension Plans include
common stock of the Corporation in the amounts of $156 million
(0.96 percent of total plan assets) and $82 million (0.55 percent
of total plan assets) at December 31, 2012 and 2011.
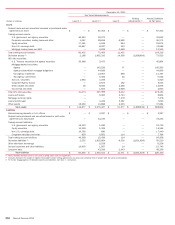
Fair Value Measurements
For information on fair value measurements, including descriptions
of Level 1, 2 and 3 of the fair value hierarchy and the valuation
methods employed by the Corporation, see Note 1 – Summary of
Significant Accounting Principles and Note 21 – Fair Value
Measurements.