Bank of America 2012 Annual Report Download - page 247
Download and view the complete annual report
Please find page 247 of the 2012 Bank of America annual report below. You can navigate through the pages in the report by either clicking on the pages listed below, or by using the keyword search tool below to find specific information within the annual report.-
 1
1 -
2
-
3
-
4
-
5
-
6
-
7
-
8
-
9
-
10
-
11
-
12
-
13
-
14
-
15
-
16
-
17
-
18
-
19
-
20
-
21
-
22
-
23
-
24
-
25
-
26
-
27
-
28
-
29
-
30
-
31
-
32
-
33
-
34
-
35
-
36
-
37
-
38
-
39
-
40
-
41
-
42
-
43
-
44
-
45
-
46
-
47
-
48
-
49
-
50
-
51
-
52
-
53
-
54
-
55
-
56
-
57
-
58
-
59
-
60
-
61
-
62
-
63
-
64
-
65
-
66
-
67
-
68
-
69
-
70
-
71
-
72
-
73
-
74
-
75
-
76
-
77
-
78
-
79
-
80
-
81
-
82
-
83
-
84
-
85
-
86
-
87
-
88
-
89
-
90
-
91
-
92
-
93
-
94
-
95
-
96
-
97
-
98
-
99
-
100
-
101
-
102
-
103
-
104
-
105
-
106
-
107
-
108
-
109
-
110
-
111
-
112
-
113
-
114
-
115
-
116
-
117
-
118
-
119
-
120
-
121
-
122
-
123
-
124
-
125
-
126
-
127
-
128
-
129
-
130
-
131
-
132
-
133
-
134
-
135
-
136
-
137
-
138
-
139
-
140
-
141
-
142
-
143
-
144
-
145
-
146
-
147
-
148
-
149
-
150
-
151
-
152
-
153
-
154
-
155
-
156
-
157
-
158
-
159
-
160
-
161
-
162
-
163
-
164
-
165
-
166
-
167
-
168
-
169
-
170
-
171
-
172
-
173
-
174
-
175
-
176
-
177
-
178
-
179
-
180
-
181
-
182
-
183
-
184
-
185
-
186
-
187
-
188
-
189
-
190
-
191
-
192
-
193
-
194
-
195
-
196
-
197
-
198
-
199
-
200
-
201
-
202
-
203
-
204
-
205
-
206
-
207
-
208
-
209
-
210
-
211
-
212
-
213
-
214
-
215
-
216
-
217
-
218
-
219
-
220
-
221
-
222
-
223
-
224
-
225
-
226
-
227
-
228
-
229
-
230
-
231
-
232
-
233
-
234
-
235
-
236
-
 237
237 -
 238
238 -
 239
239 -
 240
240 -
 241
241 -
 242
242 -
 243
243 -
 244
244 -
 245
245 -
 246
246 -
 247
247 -
 248
248 -
 249
249 -
 250
250 -
 251
251 -
 252
252 -
 253
253 -
 254
254 -
 255
255 -
 256
256 -
 257
257 -
258
-
259
-
260
-
261
-
262
-
263
-
264
-
265
-
266
-
267
-
268
-
269
-
270
-
271
-
272
-
273
-
274
-
275
-
276
-
277
-
278
-
279
-
280
-
281
-
282
-
283
-
284
 |
 |

Bank of America 2012 245
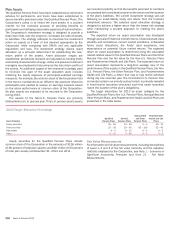
Pension Plans, and Postretirement Health and Life Plans, the 25
bps decline in rates would not have a significant impact.
Assumed health care cost trend rates affect the postretirement
benefit obligation and benefit cost reported for the Postretirement
Health and Life Plans. The assumed health care cost trend rate
used to measure the expected cost of benefits covered by the
Postretirement Health and Life Plans was 7.50 percent for 2013,
reducing in steps to 5.00 percent in 2019 and later years. A one-
percentage-point increase in assumed health care cost trend rates
would have increased the service and interest costs, and the
benefit obligation by $3 million and $59 million in 2012. A one-
percentage-point decrease in assumed health care cost trend
rates would have lowered the service and interest costs, and the
benefit obligation by $3 million and $52 million in 2012.
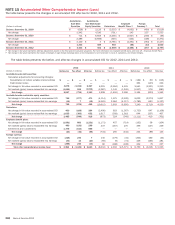
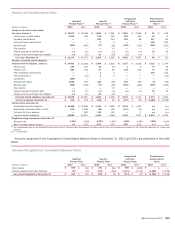
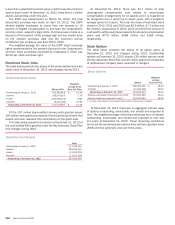
Pre-tax amounts included in accumulated OCI for employee
benefit plans at December 31, 2012 and 2011 are presented in
the table below.
Pre-tax Amounts included in Accumulated OCI
Qualified
Pension Plans
Non-U.S.
Pension Plans
Nonqualified
and Other
Pension Plans
Postretirement
Health and
Life Plans Total
(Dollars in millions) 2012 2011 2012 2011 2012 2011 2012 2011 2012 2011
Net actuarial loss (gain) $ 6,164 $ 6,743 $144 $ (212) $718 $ 409 $ (28) $ (59) $ 6,998 $ 6,881
Transition obligation ———————32 —32
Prior service cost (credits) —67 53—(7)29 33 34 96
Amounts recognized in accumulated OCI $ 6,164 $ 6,810 $149 $ (209) $718 $ 402 $1
$6
$ 7,032 $ 7,009
Pre-tax amounts recognized in OCI for employee benefit plans in 2012 included the following components.
Pre-tax Amounts Recognized in OCI
(Dollars in millions)
Qualified
Pension Plans
Non-U.S.
Pension Plans
Nonqualified
and Other
Pension Plans
Postretirement
Health and
Life Plans Total
Other changes in plan assets and benefit obligations recognized in OCI
Current year actuarial loss (gain) $ (110) $ 347 $ 321 $ (7) $ 551
Amortization of actuarial gain (loss) (469) 9 (12) 38 (434)
Current year prior service cost — 2 — — 2
Amortization of prior service credits (cost) (67) — 7 (4) (64)
Amortization of transition obligation — — — (32) (32)
Amounts recognized in OCI $ (646) $ 358 $316 $(5)$ 23
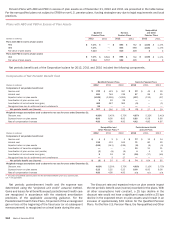
The estimated pre-tax amounts that will be amortized from accumulated OCI into expense in 2013 are presented in the table below.
Estimated Pre-tax Amounts from Accumulated OCI into Period Cost
(Dollars in millions)
Qualified
Pension Plans
Non-U.S.
Pension Plans
Nonqualified
and Other
Pension Plans
Postretirement
Health and
Life Plans Total
Net actuarial loss (gain) $ 284 $ 4$ 26 $ (20) $ 294
Prior service cost — 1 — 4 5
Total amortized from accumulated OCI $ 284 $ 5$ 26 $ (16) $ 299